Filipino vs Immigrants from Micronesia High School Diploma
COMPARE
Filipino
Immigrants from Micronesia
High School Diploma
High School Diploma Comparison
Filipinos
Immigrants from Micronesia
91.6%
HIGH SCHOOL DIPLOMA
99.9/ 100
METRIC RATING
21st/ 347
METRIC RANK
88.6%
HIGH SCHOOL DIPLOMA
16.4/ 100
METRIC RATING
205th/ 347
METRIC RANK
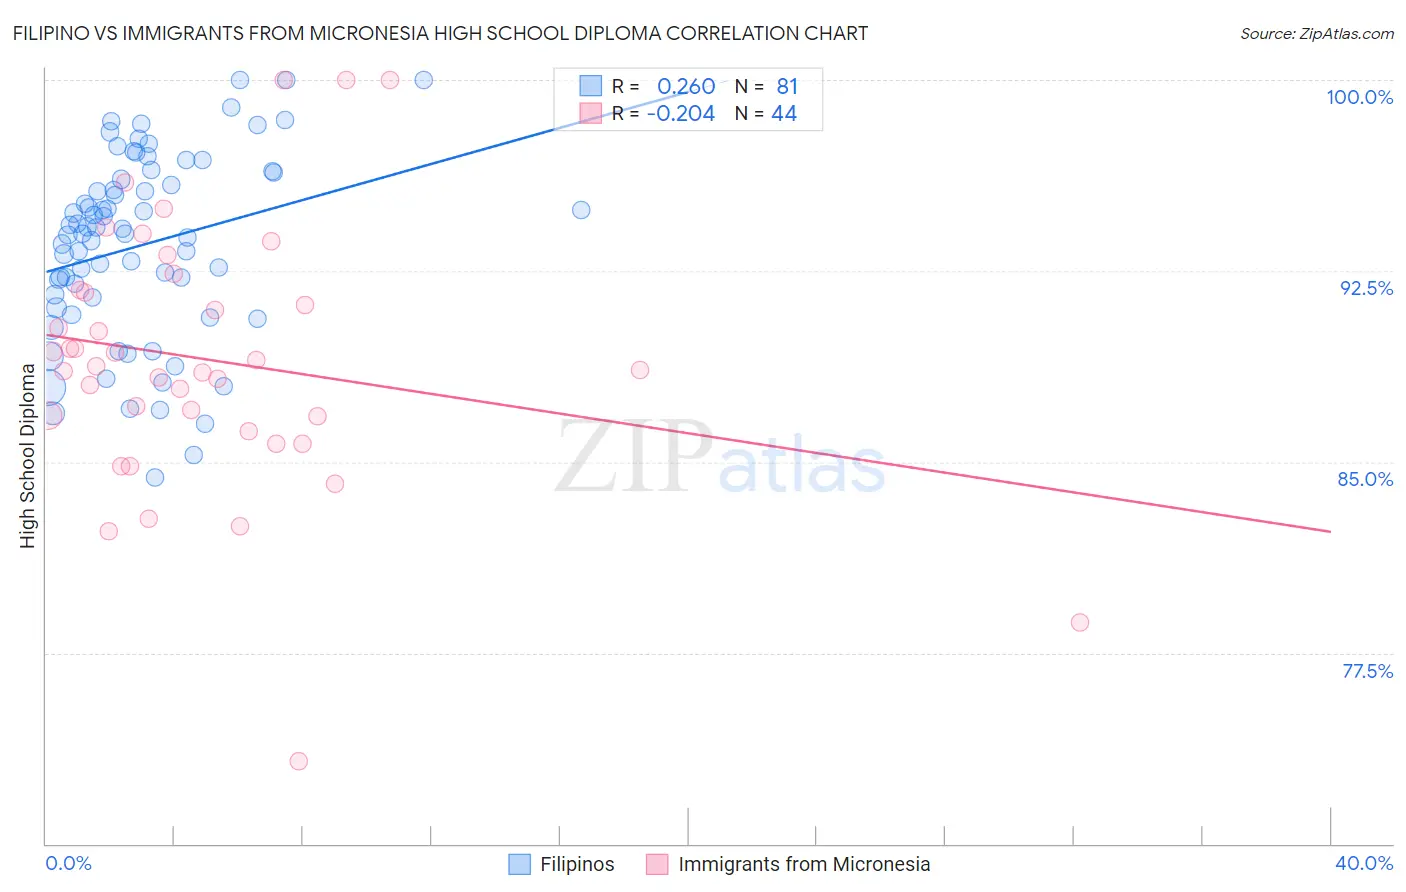
Filipino vs Immigrants from Micronesia High School Diploma Correlation Chart
The statistical analysis conducted on geographies consisting of 254,351,912 people shows a weak positive correlation between the proportion of Filipinos and percentage of population with at least high school diploma education in the United States with a correlation coefficient (R) of 0.260 and weighted average of 91.6%. Similarly, the statistical analysis conducted on geographies consisting of 61,609,499 people shows a weak negative correlation between the proportion of Immigrants from Micronesia and percentage of population with at least high school diploma education in the United States with a correlation coefficient (R) of -0.204 and weighted average of 88.6%, a difference of 3.4%.
High School Diploma Correlation Summary
| Measurement | Filipino | Immigrants from Micronesia |
| Minimum | 84.4% | 73.2% |
| Maximum | 100.0% | 100.0% |
| Range | 15.6% | 26.8% |
| Mean | 93.5% | 89.0% |
| Median | 94.0% | 88.7% |
| Interquartile 25% (IQ1) | 91.2% | 86.5% |
| Interquartile 75% (IQ3) | 96.2% | 91.7% |
| Interquartile Range (IQR) | 5.0% | 5.2% |
| Standard Deviation (Sample) | 3.6% | 5.2% |
| Standard Deviation (Population) | 3.6% | 5.1% |
Similar Demographics by High School Diploma
Demographics Similar to Filipinos by High School Diploma
In terms of high school diploma, the demographic groups most similar to Filipinos are Czech (91.6%, a difference of 0.010%), Estonian (91.6%, a difference of 0.010%), Maltese (91.6%, a difference of 0.040%), Scandinavian (91.5%, a difference of 0.040%), and Italian (91.5%, a difference of 0.040%).
| Demographics | Rating | Rank | High School Diploma |
| Bulgarians | 100.0 /100 | #14 | Exceptional 91.8% |
| Luxembourgers | 100.0 /100 | #15 | Exceptional 91.7% |
| Finns | 100.0 /100 | #16 | Exceptional 91.7% |
| Immigrants | Singapore | 99.9 /100 | #17 | Exceptional 91.7% |
| Germans | 99.9 /100 | #18 | Exceptional 91.7% |
| Maltese | 99.9 /100 | #19 | Exceptional 91.6% |
| Czechs | 99.9 /100 | #20 | Exceptional 91.6% |
| Filipinos | 99.9 /100 | #21 | Exceptional 91.6% |
| Estonians | 99.9 /100 | #22 | Exceptional 91.6% |
| Scandinavians | 99.9 /100 | #23 | Exceptional 91.5% |
| Italians | 99.9 /100 | #24 | Exceptional 91.5% |
| Thais | 99.9 /100 | #25 | Exceptional 91.5% |
| Russians | 99.9 /100 | #26 | Exceptional 91.5% |
| Cypriots | 99.9 /100 | #27 | Exceptional 91.5% |
| Tlingit-Haida | 99.9 /100 | #28 | Exceptional 91.4% |
Demographics Similar to Immigrants from Micronesia by High School Diploma
In terms of high school diploma, the demographic groups most similar to Immigrants from Micronesia are Arapaho (88.6%, a difference of 0.010%), Armenian (88.6%, a difference of 0.020%), Immigrants from Sierra Leone (88.6%, a difference of 0.020%), Somali (88.6%, a difference of 0.030%), and Panamanian (88.6%, a difference of 0.040%).
| Demographics | Rating | Rank | High School Diploma |
| Liberians | 18.8 /100 | #198 | Poor 88.7% |
| Marshallese | 18.7 /100 | #199 | Poor 88.6% |
| Hawaiians | 18.3 /100 | #200 | Poor 88.6% |
| Koreans | 18.1 /100 | #201 | Poor 88.6% |
| Panamanians | 18.0 /100 | #202 | Poor 88.6% |
| Somalis | 17.5 /100 | #203 | Poor 88.6% |
| Armenians | 17.2 /100 | #204 | Poor 88.6% |
| Immigrants | Micronesia | 16.4 /100 | #205 | Poor 88.6% |
| Arapaho | 16.1 /100 | #206 | Poor 88.6% |
| Immigrants | Sierra Leone | 15.8 /100 | #207 | Poor 88.6% |
| Portuguese | 14.4 /100 | #208 | Poor 88.5% |
| Cherokee | 14.3 /100 | #209 | Poor 88.5% |
| Samoans | 14.0 /100 | #210 | Poor 88.5% |
| Inupiat | 13.1 /100 | #211 | Poor 88.5% |
| South American Indians | 12.2 /100 | #212 | Poor 88.5% |