Arab vs Immigrants from Micronesia High School Diploma
COMPARE
Arab
Immigrants from Micronesia
High School Diploma
High School Diploma Comparison
Arabs
Immigrants from Micronesia
89.7%
HIGH SCHOOL DIPLOMA
83.6/ 100
METRIC RATING
137th/ 347
METRIC RANK
88.6%
HIGH SCHOOL DIPLOMA
16.4/ 100
METRIC RATING
205th/ 347
METRIC RANK
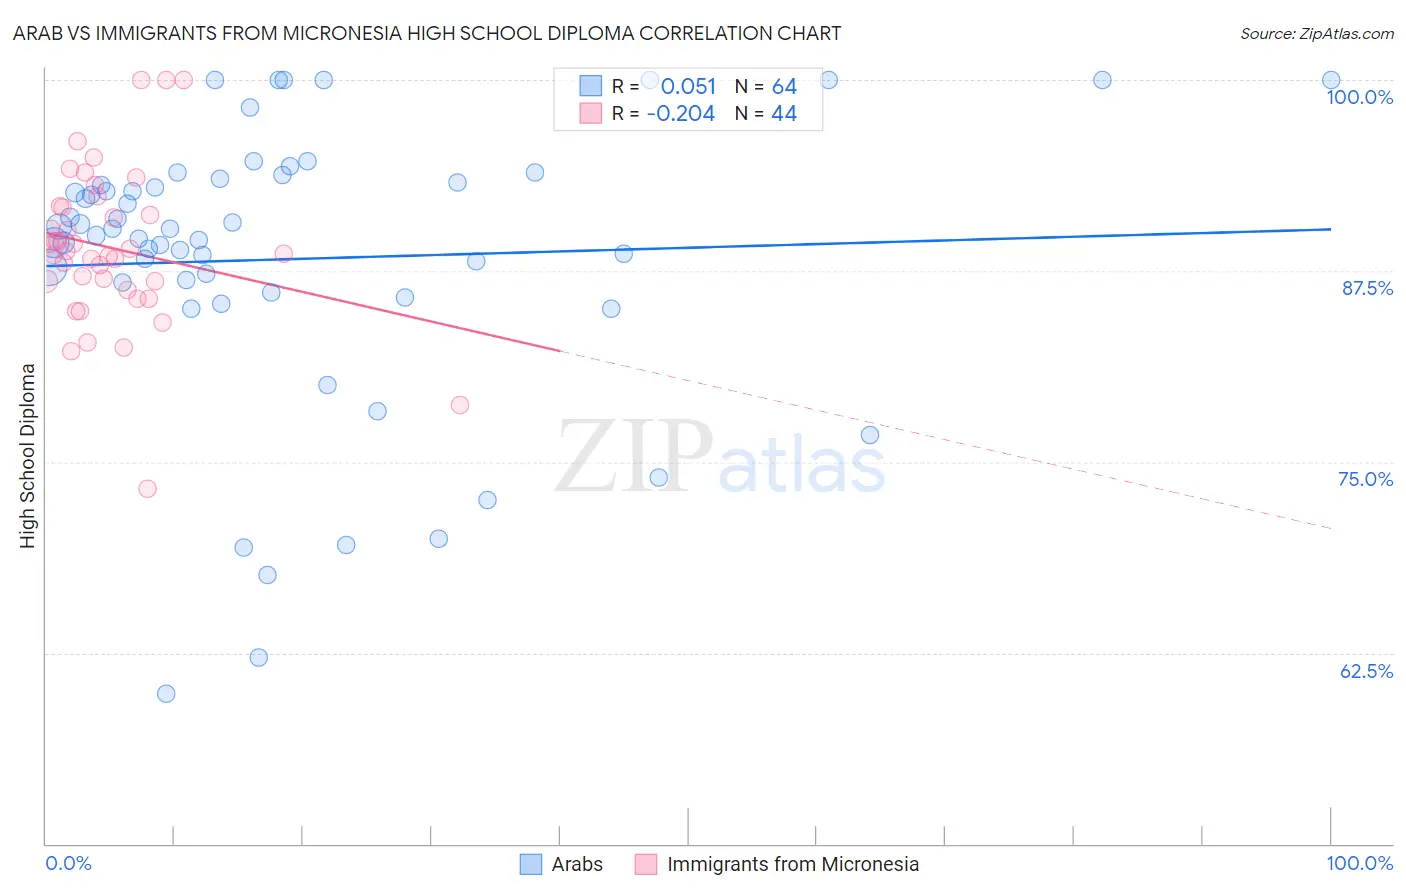
Arab vs Immigrants from Micronesia High School Diploma Correlation Chart
The statistical analysis conducted on geographies consisting of 486,870,847 people shows a slight positive correlation between the proportion of Arabs and percentage of population with at least high school diploma education in the United States with a correlation coefficient (R) of 0.051 and weighted average of 89.7%. Similarly, the statistical analysis conducted on geographies consisting of 61,609,499 people shows a weak negative correlation between the proportion of Immigrants from Micronesia and percentage of population with at least high school diploma education in the United States with a correlation coefficient (R) of -0.204 and weighted average of 88.6%, a difference of 1.2%.
High School Diploma Correlation Summary
| Measurement | Arab | Immigrants from Micronesia |
| Minimum | 59.8% | 73.2% |
| Maximum | 100.0% | 100.0% |
| Range | 40.2% | 26.8% |
| Mean | 88.3% | 89.0% |
| Median | 90.0% | 88.7% |
| Interquartile 25% (IQ1) | 86.4% | 86.5% |
| Interquartile 75% (IQ3) | 93.4% | 91.7% |
| Interquartile Range (IQR) | 7.0% | 5.2% |
| Standard Deviation (Sample) | 9.3% | 5.2% |
| Standard Deviation (Population) | 9.2% | 5.1% |
Similar Demographics by High School Diploma
Demographics Similar to Arabs by High School Diploma
In terms of high school diploma, the demographic groups most similar to Arabs are Ugandan (89.7%, a difference of 0.0%), Assyrian/Chaldean/Syriac (89.7%, a difference of 0.030%), Chippewa (89.7%, a difference of 0.060%), Kenyan (89.6%, a difference of 0.060%), and Immigrants from Egypt (89.6%, a difference of 0.060%).
| Demographics | Rating | Rank | High School Diploma |
| Immigrants | Ukraine | 87.9 /100 | #130 | Excellent 89.8% |
| Immigrants | Italy | 87.4 /100 | #131 | Excellent 89.8% |
| Immigrants | Bosnia and Herzegovina | 87.3 /100 | #132 | Excellent 89.8% |
| Albanians | 87.2 /100 | #133 | Excellent 89.8% |
| Immigrants | Jordan | 87.2 /100 | #134 | Excellent 89.8% |
| Chippewa | 85.6 /100 | #135 | Excellent 89.7% |
| Ugandans | 83.7 /100 | #136 | Excellent 89.7% |
| Arabs | 83.6 /100 | #137 | Excellent 89.7% |
| Assyrians/Chaldeans/Syriacs | 82.5 /100 | #138 | Excellent 89.7% |
| Kenyans | 81.4 /100 | #139 | Excellent 89.6% |
| Immigrants | Egypt | 81.2 /100 | #140 | Excellent 89.6% |
| Chileans | 79.0 /100 | #141 | Good 89.6% |
| Indians (Asian) | 78.8 /100 | #142 | Good 89.6% |
| Pakistanis | 78.3 /100 | #143 | Good 89.6% |
| Immigrants | Kenya | 78.0 /100 | #144 | Good 89.6% |
Demographics Similar to Immigrants from Micronesia by High School Diploma
In terms of high school diploma, the demographic groups most similar to Immigrants from Micronesia are Arapaho (88.6%, a difference of 0.010%), Armenian (88.6%, a difference of 0.020%), Immigrants from Sierra Leone (88.6%, a difference of 0.020%), Somali (88.6%, a difference of 0.030%), and Panamanian (88.6%, a difference of 0.040%).
| Demographics | Rating | Rank | High School Diploma |
| Liberians | 18.8 /100 | #198 | Poor 88.7% |
| Marshallese | 18.7 /100 | #199 | Poor 88.6% |
| Hawaiians | 18.3 /100 | #200 | Poor 88.6% |
| Koreans | 18.1 /100 | #201 | Poor 88.6% |
| Panamanians | 18.0 /100 | #202 | Poor 88.6% |
| Somalis | 17.5 /100 | #203 | Poor 88.6% |
| Armenians | 17.2 /100 | #204 | Poor 88.6% |
| Immigrants | Micronesia | 16.4 /100 | #205 | Poor 88.6% |
| Arapaho | 16.1 /100 | #206 | Poor 88.6% |
| Immigrants | Sierra Leone | 15.8 /100 | #207 | Poor 88.6% |
| Portuguese | 14.4 /100 | #208 | Poor 88.5% |
| Cherokee | 14.3 /100 | #209 | Poor 88.5% |
| Samoans | 14.0 /100 | #210 | Poor 88.5% |
| Inupiat | 13.1 /100 | #211 | Poor 88.5% |
| South American Indians | 12.2 /100 | #212 | Poor 88.5% |