Native/Alaskan vs Austrian High School Diploma
COMPARE
Native/Alaskan
Austrian
High School Diploma
High School Diploma Comparison
Natives/Alaskans
Austrians
85.6%
HIGH SCHOOL DIPLOMA
0.0/ 100
METRIC RATING
298th/ 347
METRIC RANK
91.0%
HIGH SCHOOL DIPLOMA
99.6/ 100
METRIC RATING
62nd/ 347
METRIC RANK
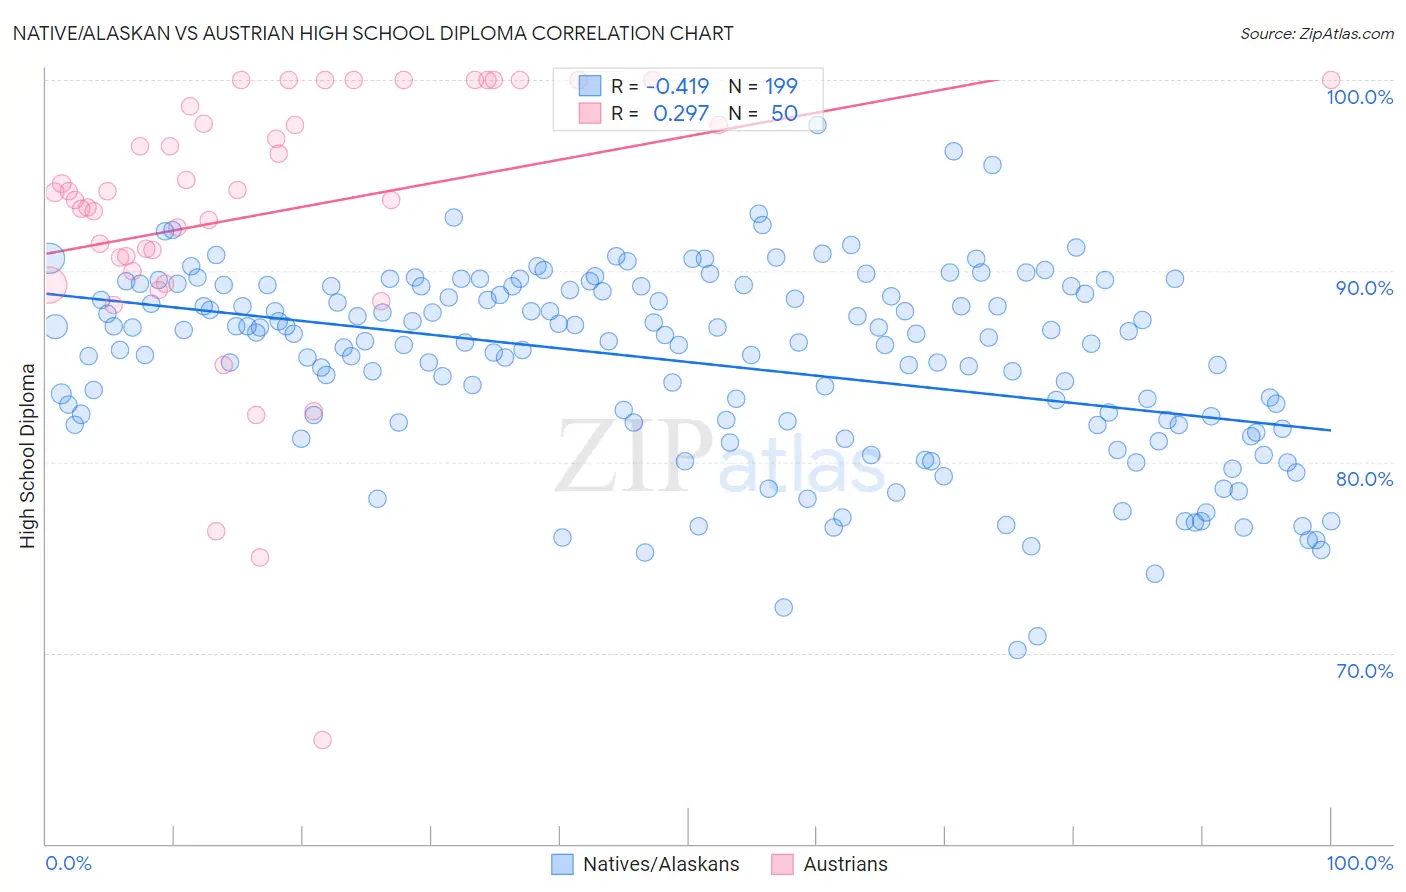
Native/Alaskan vs Austrian High School Diploma Correlation Chart
The statistical analysis conducted on geographies consisting of 513,075,731 people shows a moderate negative correlation between the proportion of Natives/Alaskans and percentage of population with at least high school diploma education in the United States with a correlation coefficient (R) of -0.419 and weighted average of 85.6%. Similarly, the statistical analysis conducted on geographies consisting of 452,082,614 people shows a weak positive correlation between the proportion of Austrians and percentage of population with at least high school diploma education in the United States with a correlation coefficient (R) of 0.297 and weighted average of 91.0%, a difference of 6.4%.
High School Diploma Correlation Summary
| Measurement | Native/Alaskan | Austrian |
| Minimum | 70.2% | 65.4% |
| Maximum | 97.6% | 100.0% |
| Range | 27.5% | 34.6% |
| Mean | 85.2% | 93.0% |
| Median | 86.3% | 94.1% |
| Interquartile 25% (IQ1) | 82.1% | 90.7% |
| Interquartile 75% (IQ3) | 89.2% | 98.6% |
| Interquartile Range (IQR) | 7.1% | 7.9% |
| Standard Deviation (Sample) | 5.0% | 7.2% |
| Standard Deviation (Population) | 4.9% | 7.1% |
Similar Demographics by High School Diploma
Demographics Similar to Natives/Alaskans by High School Diploma
In terms of high school diploma, the demographic groups most similar to Natives/Alaskans are Immigrants from Grenada (85.6%, a difference of 0.020%), Immigrants from Cambodia (85.6%, a difference of 0.090%), Guyanese (85.5%, a difference of 0.10%), Immigrants from Bangladesh (85.5%, a difference of 0.12%), and Vietnamese (85.4%, a difference of 0.14%).
| Demographics | Rating | Rank | High School Diploma |
| Haitians | 0.0 /100 | #291 | Tragic 85.9% |
| Japanese | 0.0 /100 | #292 | Tragic 85.9% |
| British West Indians | 0.0 /100 | #293 | Tragic 85.9% |
| Immigrants | Fiji | 0.0 /100 | #294 | Tragic 85.8% |
| Immigrants | Immigrants | 0.0 /100 | #295 | Tragic 85.8% |
| Immigrants | Cambodia | 0.0 /100 | #296 | Tragic 85.6% |
| Immigrants | Grenada | 0.0 /100 | #297 | Tragic 85.6% |
| Natives/Alaskans | 0.0 /100 | #298 | Tragic 85.6% |
| Guyanese | 0.0 /100 | #299 | Tragic 85.5% |
| Immigrants | Bangladesh | 0.0 /100 | #300 | Tragic 85.5% |
| Vietnamese | 0.0 /100 | #301 | Tragic 85.4% |
| Immigrants | Haiti | 0.0 /100 | #302 | Tragic 85.4% |
| Cubans | 0.0 /100 | #303 | Tragic 85.4% |
| Nepalese | 0.0 /100 | #304 | Tragic 85.3% |
| Immigrants | Portugal | 0.0 /100 | #305 | Tragic 85.3% |
Demographics Similar to Austrians by High School Diploma
In terms of high school diploma, the demographic groups most similar to Austrians are Immigrants from Taiwan (91.0%, a difference of 0.020%), Immigrants from Japan (91.0%, a difference of 0.030%), Immigrants from Netherlands (91.0%, a difference of 0.030%), Ukrainian (91.0%, a difference of 0.030%), and Immigrants from South Africa (91.0%, a difference of 0.040%).
| Demographics | Rating | Rank | High School Diploma |
| Serbians | 99.7 /100 | #55 | Exceptional 91.1% |
| Immigrants | Canada | 99.7 /100 | #56 | Exceptional 91.1% |
| Zimbabweans | 99.7 /100 | #57 | Exceptional 91.1% |
| Slavs | 99.7 /100 | #58 | Exceptional 91.0% |
| Immigrants | North America | 99.7 /100 | #59 | Exceptional 91.0% |
| Immigrants | Japan | 99.6 /100 | #60 | Exceptional 91.0% |
| Immigrants | Taiwan | 99.6 /100 | #61 | Exceptional 91.0% |
| Austrians | 99.6 /100 | #62 | Exceptional 91.0% |
| Immigrants | Netherlands | 99.6 /100 | #63 | Exceptional 91.0% |
| Ukrainians | 99.6 /100 | #64 | Exceptional 91.0% |
| Immigrants | South Africa | 99.6 /100 | #65 | Exceptional 91.0% |
| French | 99.5 /100 | #66 | Exceptional 91.0% |
| Immigrants | Iran | 99.5 /100 | #67 | Exceptional 90.9% |
| Czechoslovakians | 99.5 /100 | #68 | Exceptional 90.9% |
| French Canadians | 99.5 /100 | #69 | Exceptional 90.9% |