Native/Alaskan vs Pueblo High School Diploma
COMPARE
Native/Alaskan
Pueblo
High School Diploma
High School Diploma Comparison
Natives/Alaskans
Pueblo
85.6%
HIGH SCHOOL DIPLOMA
0.0/ 100
METRIC RATING
298th/ 347
METRIC RANK
86.5%
HIGH SCHOOL DIPLOMA
0.0/ 100
METRIC RATING
280th/ 347
METRIC RANK
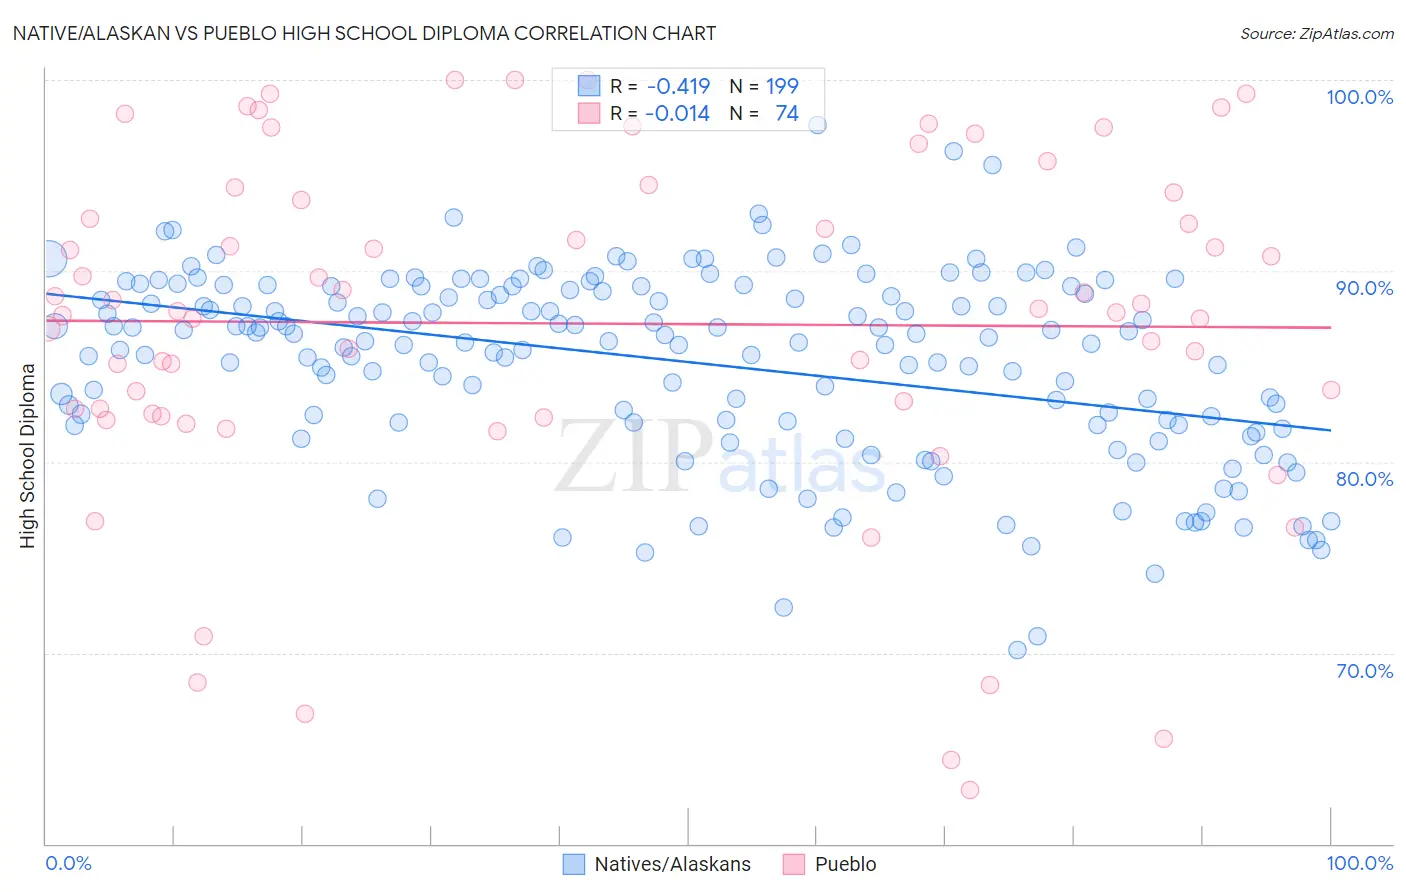
Native/Alaskan vs Pueblo High School Diploma Correlation Chart
The statistical analysis conducted on geographies consisting of 513,075,731 people shows a moderate negative correlation between the proportion of Natives/Alaskans and percentage of population with at least high school diploma education in the United States with a correlation coefficient (R) of -0.419 and weighted average of 85.6%. Similarly, the statistical analysis conducted on geographies consisting of 120,086,593 people shows no correlation between the proportion of Pueblo and percentage of population with at least high school diploma education in the United States with a correlation coefficient (R) of -0.014 and weighted average of 86.5%, a difference of 1.1%.
High School Diploma Correlation Summary
| Measurement | Native/Alaskan | Pueblo |
| Minimum | 70.2% | 62.8% |
| Maximum | 97.6% | 100.0% |
| Range | 27.5% | 37.2% |
| Mean | 85.2% | 87.2% |
| Median | 86.3% | 88.0% |
| Interquartile 25% (IQ1) | 82.1% | 82.5% |
| Interquartile 75% (IQ3) | 89.2% | 94.1% |
| Interquartile Range (IQR) | 7.1% | 11.6% |
| Standard Deviation (Sample) | 5.0% | 9.1% |
| Standard Deviation (Population) | 4.9% | 9.1% |
Demographics Similar to Natives/Alaskans and Pueblo by High School Diploma
In terms of high school diploma, the demographic groups most similar to Natives/Alaskans are Immigrants from Grenada (85.6%, a difference of 0.020%), Immigrants from Cambodia (85.6%, a difference of 0.090%), Guyanese (85.5%, a difference of 0.10%), Immigrants (85.8%, a difference of 0.30%), and Immigrants from Fiji (85.8%, a difference of 0.32%). Similarly, the demographic groups most similar to Pueblo are Immigrants from Laos (86.6%, a difference of 0.020%), Indonesian (86.5%, a difference of 0.050%), Dutch West Indian (86.5%, a difference of 0.090%), Immigrants from Barbados (86.4%, a difference of 0.15%), and Paiute (86.4%, a difference of 0.20%).
| Demographics | Rating | Rank | High School Diploma |
| Immigrants | Laos | 0.0 /100 | #279 | Tragic 86.6% |
| Pueblo | 0.0 /100 | #280 | Tragic 86.5% |
| Indonesians | 0.0 /100 | #281 | Tragic 86.5% |
| Dutch West Indians | 0.0 /100 | #282 | Tragic 86.5% |
| Immigrants | Barbados | 0.0 /100 | #283 | Tragic 86.4% |
| Paiute | 0.0 /100 | #284 | Tragic 86.4% |
| Immigrants | West Indies | 0.0 /100 | #285 | Tragic 86.2% |
| Immigrants | St. Vincent and the Grenadines | 0.0 /100 | #286 | Tragic 86.2% |
| Ute | 0.0 /100 | #287 | Tragic 86.2% |
| Immigrants | Vietnam | 0.0 /100 | #288 | Tragic 86.2% |
| Yup'ik | 0.0 /100 | #289 | Tragic 86.1% |
| Fijians | 0.0 /100 | #290 | Tragic 86.0% |
| Haitians | 0.0 /100 | #291 | Tragic 85.9% |
| Japanese | 0.0 /100 | #292 | Tragic 85.9% |
| British West Indians | 0.0 /100 | #293 | Tragic 85.9% |
| Immigrants | Fiji | 0.0 /100 | #294 | Tragic 85.8% |
| Immigrants | Immigrants | 0.0 /100 | #295 | Tragic 85.8% |
| Immigrants | Cambodia | 0.0 /100 | #296 | Tragic 85.6% |
| Immigrants | Grenada | 0.0 /100 | #297 | Tragic 85.6% |
| Natives/Alaskans | 0.0 /100 | #298 | Tragic 85.6% |
| Guyanese | 0.0 /100 | #299 | Tragic 85.5% |