Native/Alaskan vs Immigrants from Cuba High School Diploma
COMPARE
Native/Alaskan
Immigrants from Cuba
High School Diploma
High School Diploma Comparison
Natives/Alaskans
Immigrants from Cuba
85.6%
HIGH SCHOOL DIPLOMA
0.0/ 100
METRIC RATING
298th/ 347
METRIC RANK
83.5%
HIGH SCHOOL DIPLOMA
0.0/ 100
METRIC RATING
323rd/ 347
METRIC RANK
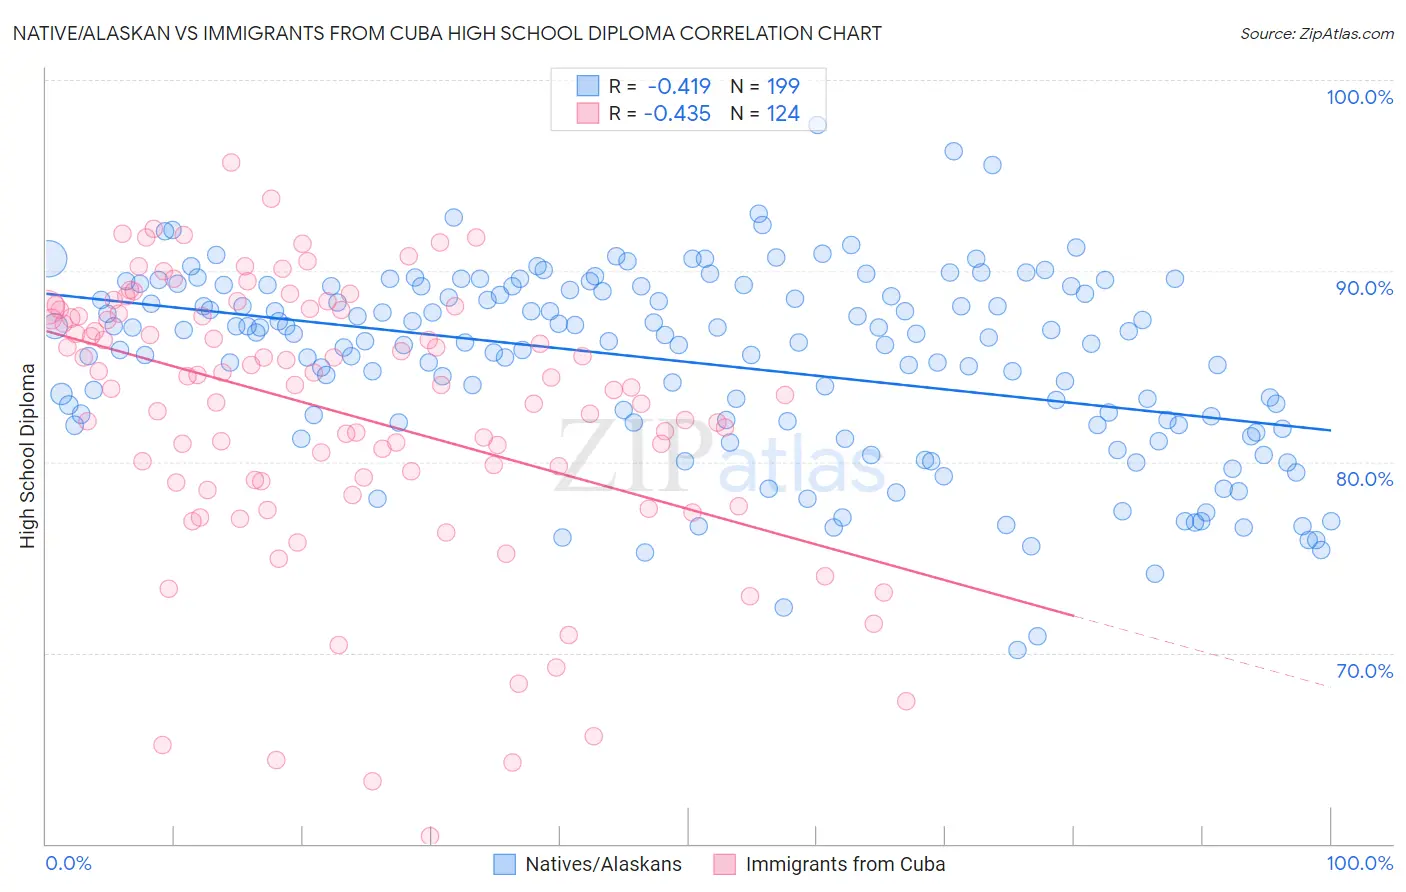
Native/Alaskan vs Immigrants from Cuba High School Diploma Correlation Chart
The statistical analysis conducted on geographies consisting of 513,075,731 people shows a moderate negative correlation between the proportion of Natives/Alaskans and percentage of population with at least high school diploma education in the United States with a correlation coefficient (R) of -0.419 and weighted average of 85.6%. Similarly, the statistical analysis conducted on geographies consisting of 326,028,082 people shows a moderate negative correlation between the proportion of Immigrants from Cuba and percentage of population with at least high school diploma education in the United States with a correlation coefficient (R) of -0.435 and weighted average of 83.5%, a difference of 2.5%.
High School Diploma Correlation Summary
| Measurement | Native/Alaskan | Immigrants from Cuba |
| Minimum | 70.2% | 60.4% |
| Maximum | 97.6% | 95.7% |
| Range | 27.5% | 35.2% |
| Mean | 85.2% | 82.6% |
| Median | 86.3% | 84.0% |
| Interquartile 25% (IQ1) | 82.1% | 79.0% |
| Interquartile 75% (IQ3) | 89.2% | 87.9% |
| Interquartile Range (IQR) | 7.1% | 8.8% |
| Standard Deviation (Sample) | 5.0% | 7.1% |
| Standard Deviation (Population) | 4.9% | 7.1% |
Similar Demographics by High School Diploma
Demographics Similar to Natives/Alaskans by High School Diploma
In terms of high school diploma, the demographic groups most similar to Natives/Alaskans are Immigrants from Grenada (85.6%, a difference of 0.020%), Immigrants from Cambodia (85.6%, a difference of 0.090%), Guyanese (85.5%, a difference of 0.10%), Immigrants from Bangladesh (85.5%, a difference of 0.12%), and Vietnamese (85.4%, a difference of 0.14%).
| Demographics | Rating | Rank | High School Diploma |
| Haitians | 0.0 /100 | #291 | Tragic 85.9% |
| Japanese | 0.0 /100 | #292 | Tragic 85.9% |
| British West Indians | 0.0 /100 | #293 | Tragic 85.9% |
| Immigrants | Fiji | 0.0 /100 | #294 | Tragic 85.8% |
| Immigrants | Immigrants | 0.0 /100 | #295 | Tragic 85.8% |
| Immigrants | Cambodia | 0.0 /100 | #296 | Tragic 85.6% |
| Immigrants | Grenada | 0.0 /100 | #297 | Tragic 85.6% |
| Natives/Alaskans | 0.0 /100 | #298 | Tragic 85.6% |
| Guyanese | 0.0 /100 | #299 | Tragic 85.5% |
| Immigrants | Bangladesh | 0.0 /100 | #300 | Tragic 85.5% |
| Vietnamese | 0.0 /100 | #301 | Tragic 85.4% |
| Immigrants | Haiti | 0.0 /100 | #302 | Tragic 85.4% |
| Cubans | 0.0 /100 | #303 | Tragic 85.4% |
| Nepalese | 0.0 /100 | #304 | Tragic 85.3% |
| Immigrants | Portugal | 0.0 /100 | #305 | Tragic 85.3% |
Demographics Similar to Immigrants from Cuba by High School Diploma
In terms of high school diploma, the demographic groups most similar to Immigrants from Cuba are Lumbee (83.6%, a difference of 0.16%), Immigrants from Cabo Verde (83.3%, a difference of 0.29%), Immigrants from Nicaragua (83.1%, a difference of 0.52%), Yuman (84.0%, a difference of 0.57%), and Mexican American Indian (83.0%, a difference of 0.59%).
| Demographics | Rating | Rank | High School Diploma |
| Belizeans | 0.0 /100 | #316 | Tragic 84.3% |
| Immigrants | Caribbean | 0.0 /100 | #317 | Tragic 84.3% |
| Immigrants | Belize | 0.0 /100 | #318 | Tragic 84.2% |
| Central American Indians | 0.0 /100 | #319 | Tragic 84.2% |
| Nicaraguans | 0.0 /100 | #320 | Tragic 84.1% |
| Yuman | 0.0 /100 | #321 | Tragic 84.0% |
| Lumbee | 0.0 /100 | #322 | Tragic 83.6% |
| Immigrants | Cuba | 0.0 /100 | #323 | Tragic 83.5% |
| Immigrants | Cabo Verde | 0.0 /100 | #324 | Tragic 83.3% |
| Immigrants | Nicaragua | 0.0 /100 | #325 | Tragic 83.1% |
| Mexican American Indians | 0.0 /100 | #326 | Tragic 83.0% |
| Hondurans | 0.0 /100 | #327 | Tragic 83.0% |
| Dominicans | 0.0 /100 | #328 | Tragic 82.9% |
| Hispanics or Latinos | 0.0 /100 | #329 | Tragic 82.9% |
| Immigrants | Azores | 0.0 /100 | #330 | Tragic 82.8% |