Choctaw vs Immigrants from Micronesia High School Diploma
COMPARE
Choctaw
Immigrants from Micronesia
High School Diploma
High School Diploma Comparison
Choctaw
Immigrants from Micronesia
87.8%
HIGH SCHOOL DIPLOMA
1.9/ 100
METRIC RATING
244th/ 347
METRIC RANK
88.6%
HIGH SCHOOL DIPLOMA
16.4/ 100
METRIC RATING
205th/ 347
METRIC RANK
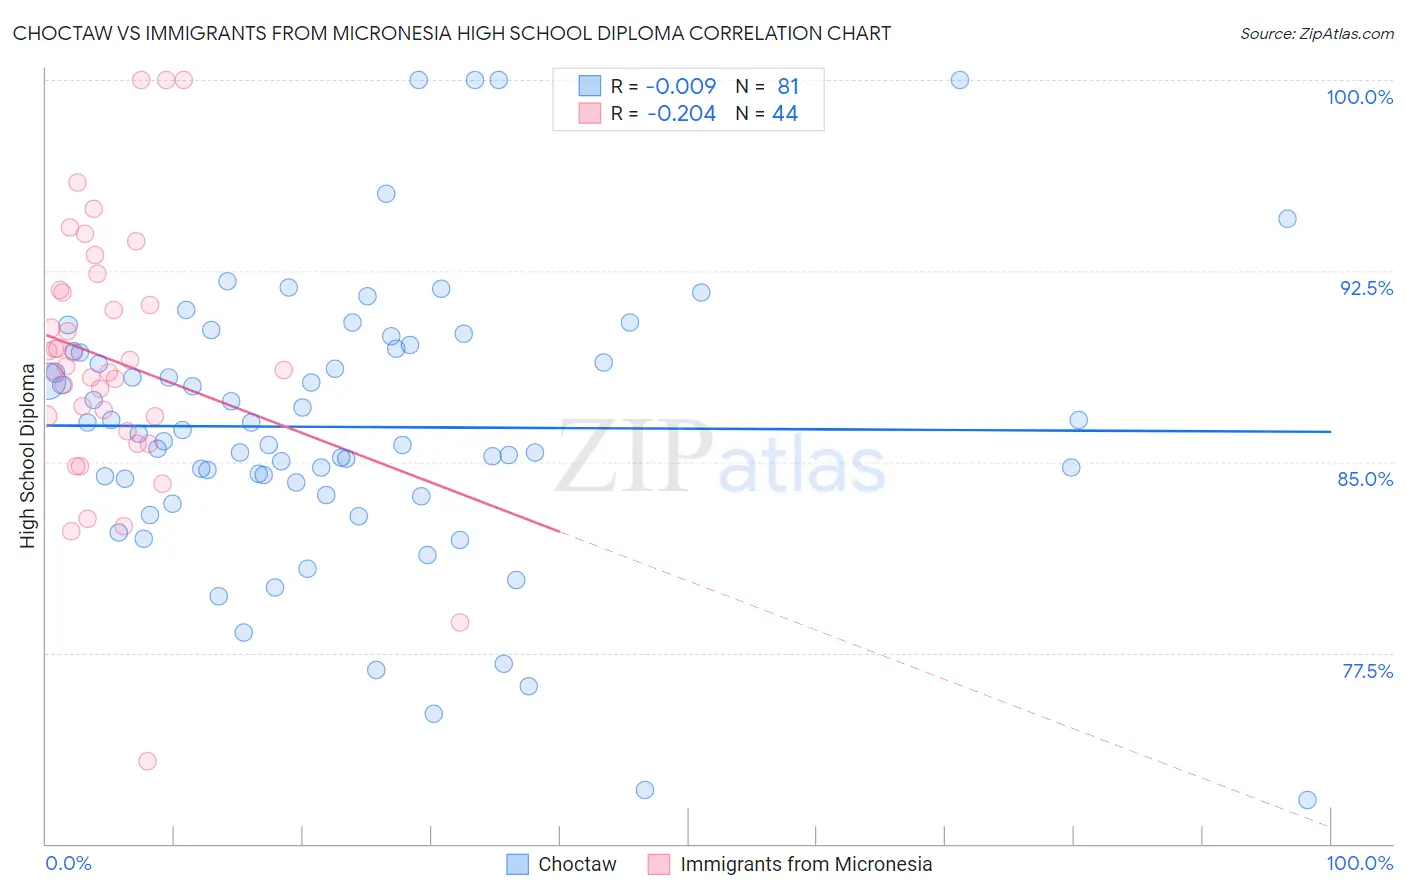
Choctaw vs Immigrants from Micronesia High School Diploma Correlation Chart
The statistical analysis conducted on geographies consisting of 269,738,650 people shows no correlation between the proportion of Choctaw and percentage of population with at least high school diploma education in the United States with a correlation coefficient (R) of -0.009 and weighted average of 87.8%. Similarly, the statistical analysis conducted on geographies consisting of 61,609,499 people shows a weak negative correlation between the proportion of Immigrants from Micronesia and percentage of population with at least high school diploma education in the United States with a correlation coefficient (R) of -0.204 and weighted average of 88.6%, a difference of 0.88%.
High School Diploma Correlation Summary
| Measurement | Choctaw | Immigrants from Micronesia |
| Minimum | 71.7% | 73.2% |
| Maximum | 100.0% | 100.0% |
| Range | 28.3% | 26.8% |
| Mean | 86.4% | 89.0% |
| Median | 86.1% | 88.7% |
| Interquartile 25% (IQ1) | 84.0% | 86.5% |
| Interquartile 75% (IQ3) | 89.4% | 91.7% |
| Interquartile Range (IQR) | 5.4% | 5.2% |
| Standard Deviation (Sample) | 5.5% | 5.2% |
| Standard Deviation (Population) | 5.5% | 5.1% |
Similar Demographics by High School Diploma
Demographics Similar to Choctaw by High School Diploma
In terms of high school diploma, the demographic groups most similar to Choctaw are Immigrants from Philippines (87.8%, a difference of 0.0%), Peruvian (87.8%, a difference of 0.010%), Immigrants from Uzbekistan (87.8%, a difference of 0.030%), Cheyenne (87.8%, a difference of 0.030%), and Immigrants from Eritrea (87.8%, a difference of 0.040%).
| Demographics | Rating | Rank | High School Diploma |
| Taiwanese | 2.8 /100 | #237 | Tragic 87.9% |
| Sioux | 2.7 /100 | #238 | Tragic 87.9% |
| South Americans | 2.7 /100 | #239 | Tragic 87.9% |
| Comanche | 2.2 /100 | #240 | Tragic 87.9% |
| Immigrants | Uzbekistan | 2.1 /100 | #241 | Tragic 87.8% |
| Cheyenne | 2.1 /100 | #242 | Tragic 87.8% |
| Immigrants | Philippines | 1.9 /100 | #243 | Tragic 87.8% |
| Choctaw | 1.9 /100 | #244 | Tragic 87.8% |
| Peruvians | 1.9 /100 | #245 | Tragic 87.8% |
| Immigrants | Eritrea | 1.7 /100 | #246 | Tragic 87.8% |
| Immigrants | Costa Rica | 1.7 /100 | #247 | Tragic 87.8% |
| Spanish Americans | 1.5 /100 | #248 | Tragic 87.7% |
| Senegalese | 1.5 /100 | #249 | Tragic 87.7% |
| Immigrants | Nigeria | 1.5 /100 | #250 | Tragic 87.7% |
| Ghanaians | 1.4 /100 | #251 | Tragic 87.7% |
Demographics Similar to Immigrants from Micronesia by High School Diploma
In terms of high school diploma, the demographic groups most similar to Immigrants from Micronesia are Arapaho (88.6%, a difference of 0.010%), Armenian (88.6%, a difference of 0.020%), Immigrants from Sierra Leone (88.6%, a difference of 0.020%), Somali (88.6%, a difference of 0.030%), and Panamanian (88.6%, a difference of 0.040%).
| Demographics | Rating | Rank | High School Diploma |
| Liberians | 18.8 /100 | #198 | Poor 88.7% |
| Marshallese | 18.7 /100 | #199 | Poor 88.6% |
| Hawaiians | 18.3 /100 | #200 | Poor 88.6% |
| Koreans | 18.1 /100 | #201 | Poor 88.6% |
| Panamanians | 18.0 /100 | #202 | Poor 88.6% |
| Somalis | 17.5 /100 | #203 | Poor 88.6% |
| Armenians | 17.2 /100 | #204 | Poor 88.6% |
| Immigrants | Micronesia | 16.4 /100 | #205 | Poor 88.6% |
| Arapaho | 16.1 /100 | #206 | Poor 88.6% |
| Immigrants | Sierra Leone | 15.8 /100 | #207 | Poor 88.6% |
| Portuguese | 14.4 /100 | #208 | Poor 88.5% |
| Cherokee | 14.3 /100 | #209 | Poor 88.5% |
| Samoans | 14.0 /100 | #210 | Poor 88.5% |
| Inupiat | 13.1 /100 | #211 | Poor 88.5% |
| South American Indians | 12.2 /100 | #212 | Poor 88.5% |