Immigrants from Argentina vs Immigrants from Cuba High School Diploma
COMPARE
Immigrants from Argentina
Immigrants from Cuba
High School Diploma
High School Diploma Comparison
Immigrants from Argentina
Immigrants from Cuba
89.4%
HIGH SCHOOL DIPLOMA
65.5/ 100
METRIC RATING
156th/ 347
METRIC RANK
83.5%
HIGH SCHOOL DIPLOMA
0.0/ 100
METRIC RATING
323rd/ 347
METRIC RANK
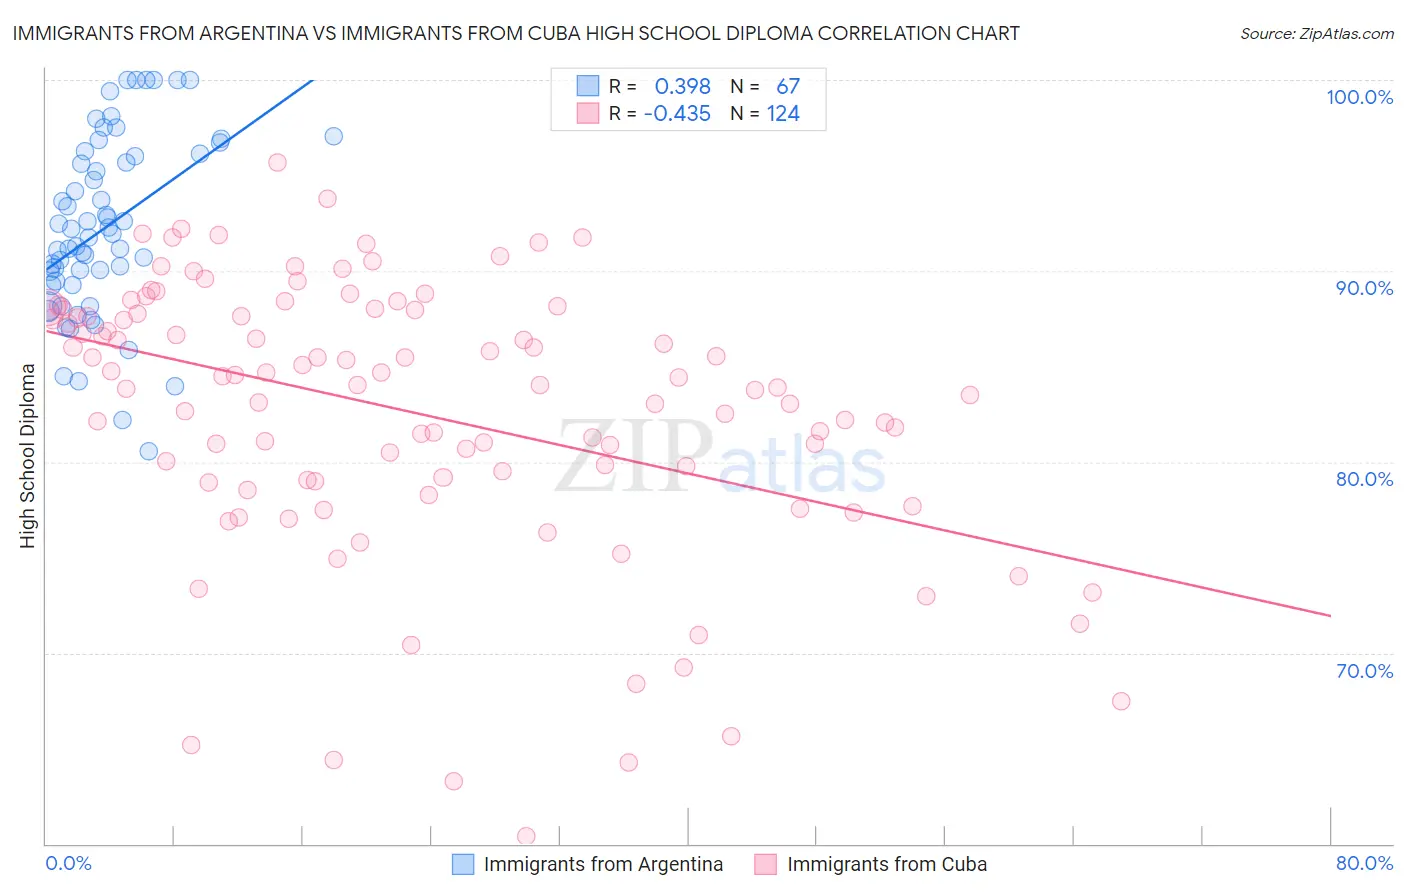
Immigrants from Argentina vs Immigrants from Cuba High School Diploma Correlation Chart
The statistical analysis conducted on geographies consisting of 264,434,241 people shows a mild positive correlation between the proportion of Immigrants from Argentina and percentage of population with at least high school diploma education in the United States with a correlation coefficient (R) of 0.398 and weighted average of 89.4%. Similarly, the statistical analysis conducted on geographies consisting of 326,028,082 people shows a moderate negative correlation between the proportion of Immigrants from Cuba and percentage of population with at least high school diploma education in the United States with a correlation coefficient (R) of -0.435 and weighted average of 83.5%, a difference of 7.0%.
High School Diploma Correlation Summary
| Measurement | Immigrants from Argentina | Immigrants from Cuba |
| Minimum | 80.6% | 60.4% |
| Maximum | 100.0% | 95.7% |
| Range | 19.4% | 35.2% |
| Mean | 92.2% | 82.6% |
| Median | 91.9% | 84.0% |
| Interquartile 25% (IQ1) | 89.3% | 79.0% |
| Interquartile 75% (IQ3) | 96.1% | 87.9% |
| Interquartile Range (IQR) | 6.8% | 8.8% |
| Standard Deviation (Sample) | 4.7% | 7.1% |
| Standard Deviation (Population) | 4.6% | 7.1% |
Similar Demographics by High School Diploma
Demographics Similar to Immigrants from Argentina by High School Diploma
In terms of high school diploma, the demographic groups most similar to Immigrants from Argentina are Alsatian (89.4%, a difference of 0.020%), Immigrants from Northern Africa (89.4%, a difference of 0.020%), Immigrants from Malaysia (89.3%, a difference of 0.030%), Immigrants from Iraq (89.4%, a difference of 0.050%), and Immigrants from Pakistan (89.3%, a difference of 0.050%).
| Demographics | Rating | Rank | High School Diploma |
| Immigrants | Poland | 72.9 /100 | #149 | Good 89.5% |
| Argentineans | 72.3 /100 | #150 | Good 89.5% |
| Paraguayans | 71.4 /100 | #151 | Good 89.5% |
| Asians | 70.7 /100 | #152 | Good 89.4% |
| Immigrants | Iraq | 68.7 /100 | #153 | Good 89.4% |
| Alsatians | 66.8 /100 | #154 | Good 89.4% |
| Immigrants | Northern Africa | 66.4 /100 | #155 | Good 89.4% |
| Immigrants | Argentina | 65.5 /100 | #156 | Good 89.4% |
| Immigrants | Malaysia | 63.5 /100 | #157 | Good 89.3% |
| Immigrants | Pakistan | 62.5 /100 | #158 | Good 89.3% |
| Immigrants | China | 62.0 /100 | #159 | Good 89.3% |
| Laotians | 61.8 /100 | #160 | Good 89.3% |
| Brazilians | 61.2 /100 | #161 | Good 89.3% |
| Bermudans | 61.1 /100 | #162 | Good 89.3% |
| Cree | 61.1 /100 | #163 | Good 89.3% |
Demographics Similar to Immigrants from Cuba by High School Diploma
In terms of high school diploma, the demographic groups most similar to Immigrants from Cuba are Lumbee (83.6%, a difference of 0.16%), Immigrants from Cabo Verde (83.3%, a difference of 0.29%), Immigrants from Nicaragua (83.1%, a difference of 0.52%), Yuman (84.0%, a difference of 0.57%), and Mexican American Indian (83.0%, a difference of 0.59%).
| Demographics | Rating | Rank | High School Diploma |
| Belizeans | 0.0 /100 | #316 | Tragic 84.3% |
| Immigrants | Caribbean | 0.0 /100 | #317 | Tragic 84.3% |
| Immigrants | Belize | 0.0 /100 | #318 | Tragic 84.2% |
| Central American Indians | 0.0 /100 | #319 | Tragic 84.2% |
| Nicaraguans | 0.0 /100 | #320 | Tragic 84.1% |
| Yuman | 0.0 /100 | #321 | Tragic 84.0% |
| Lumbee | 0.0 /100 | #322 | Tragic 83.6% |
| Immigrants | Cuba | 0.0 /100 | #323 | Tragic 83.5% |
| Immigrants | Cabo Verde | 0.0 /100 | #324 | Tragic 83.3% |
| Immigrants | Nicaragua | 0.0 /100 | #325 | Tragic 83.1% |
| Mexican American Indians | 0.0 /100 | #326 | Tragic 83.0% |
| Hondurans | 0.0 /100 | #327 | Tragic 83.0% |
| Dominicans | 0.0 /100 | #328 | Tragic 82.9% |
| Hispanics or Latinos | 0.0 /100 | #329 | Tragic 82.9% |
| Immigrants | Azores | 0.0 /100 | #330 | Tragic 82.8% |