Hungarian vs Immigrants from Cuba High School Diploma
COMPARE
Hungarian
Immigrants from Cuba
High School Diploma
High School Diploma Comparison
Hungarians
Immigrants from Cuba
90.8%
HIGH SCHOOL DIPLOMA
99.3/ 100
METRIC RATING
76th/ 347
METRIC RANK
83.5%
HIGH SCHOOL DIPLOMA
0.0/ 100
METRIC RATING
323rd/ 347
METRIC RANK
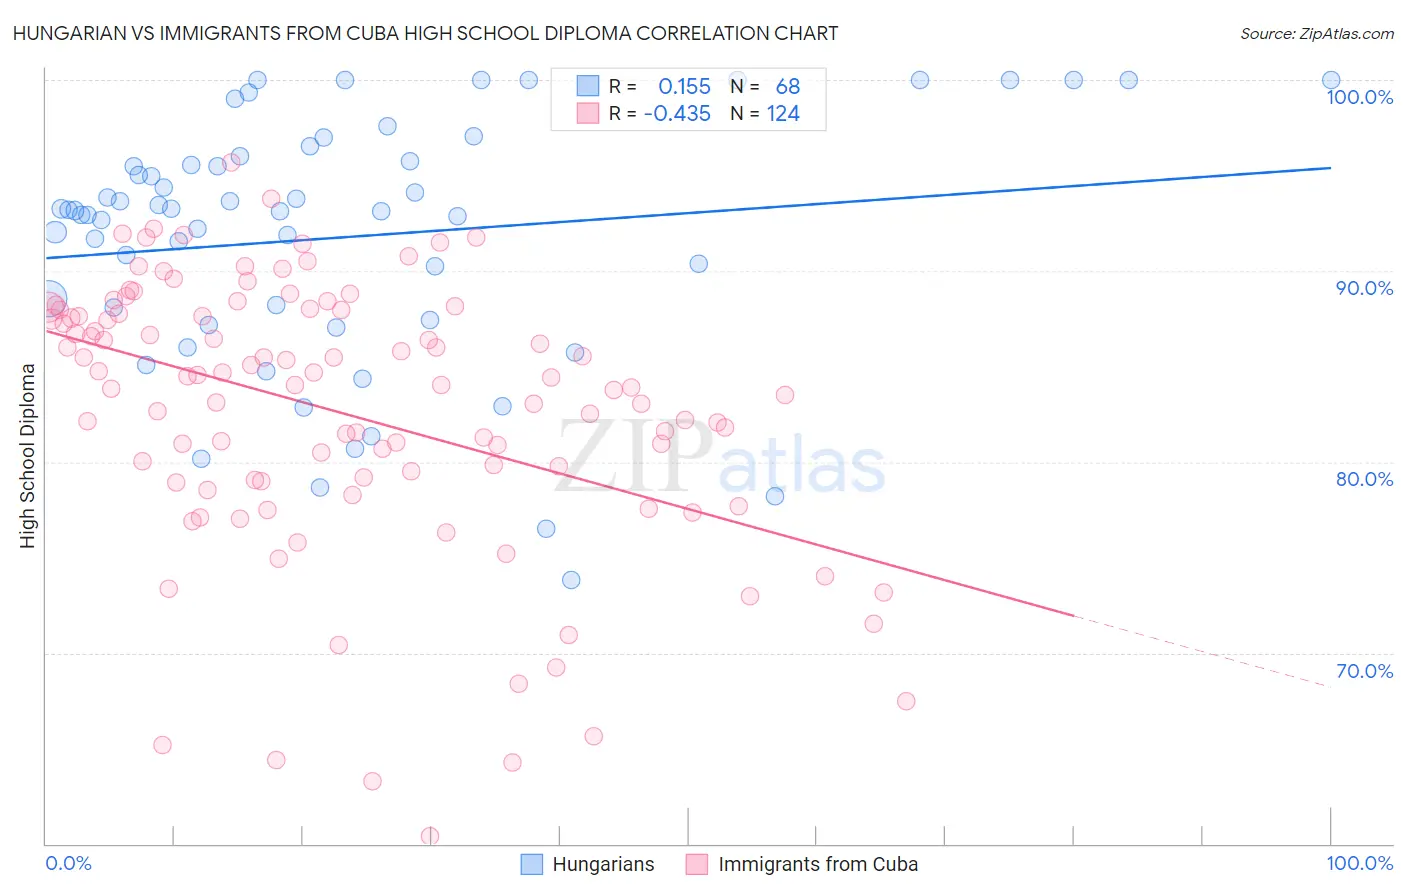
Hungarian vs Immigrants from Cuba High School Diploma Correlation Chart
The statistical analysis conducted on geographies consisting of 486,240,766 people shows a poor positive correlation between the proportion of Hungarians and percentage of population with at least high school diploma education in the United States with a correlation coefficient (R) of 0.155 and weighted average of 90.8%. Similarly, the statistical analysis conducted on geographies consisting of 326,028,082 people shows a moderate negative correlation between the proportion of Immigrants from Cuba and percentage of population with at least high school diploma education in the United States with a correlation coefficient (R) of -0.435 and weighted average of 83.5%, a difference of 8.8%.
High School Diploma Correlation Summary
| Measurement | Hungarian | Immigrants from Cuba |
| Minimum | 73.8% | 60.4% |
| Maximum | 100.0% | 95.7% |
| Range | 26.2% | 35.2% |
| Mean | 91.8% | 82.6% |
| Median | 93.2% | 84.0% |
| Interquartile 25% (IQ1) | 87.8% | 79.0% |
| Interquartile 75% (IQ3) | 95.9% | 87.9% |
| Interquartile Range (IQR) | 8.1% | 8.8% |
| Standard Deviation (Sample) | 6.5% | 7.1% |
| Standard Deviation (Population) | 6.4% | 7.1% |
Similar Demographics by High School Diploma
Demographics Similar to Hungarians by High School Diploma
In terms of high school diploma, the demographic groups most similar to Hungarians are Cambodian (90.8%, a difference of 0.010%), Native Hawaiian (90.8%, a difference of 0.010%), Burmese (90.8%, a difference of 0.010%), Immigrants from Denmark (90.8%, a difference of 0.020%), and Immigrants from Czechoslovakia (90.9%, a difference of 0.030%).
| Demographics | Rating | Rank | High School Diploma |
| French Canadians | 99.5 /100 | #69 | Exceptional 90.9% |
| Immigrants | Latvia | 99.5 /100 | #70 | Exceptional 90.9% |
| Alaskan Athabascans | 99.4 /100 | #71 | Exceptional 90.9% |
| Soviet Union | 99.4 /100 | #72 | Exceptional 90.9% |
| Immigrants | South Central Asia | 99.4 /100 | #73 | Exceptional 90.9% |
| Immigrants | Czechoslovakia | 99.4 /100 | #74 | Exceptional 90.9% |
| Cambodians | 99.4 /100 | #75 | Exceptional 90.8% |
| Hungarians | 99.3 /100 | #76 | Exceptional 90.8% |
| Native Hawaiians | 99.3 /100 | #77 | Exceptional 90.8% |
| Burmese | 99.3 /100 | #78 | Exceptional 90.8% |
| Immigrants | Denmark | 99.3 /100 | #79 | Exceptional 90.8% |
| Immigrants | England | 99.3 /100 | #80 | Exceptional 90.8% |
| Immigrants | Switzerland | 99.3 /100 | #81 | Exceptional 90.8% |
| Scotch-Irish | 99.2 /100 | #82 | Exceptional 90.8% |
| Immigrants | Moldova | 99.2 /100 | #83 | Exceptional 90.7% |
Demographics Similar to Immigrants from Cuba by High School Diploma
In terms of high school diploma, the demographic groups most similar to Immigrants from Cuba are Lumbee (83.6%, a difference of 0.16%), Immigrants from Cabo Verde (83.3%, a difference of 0.29%), Immigrants from Nicaragua (83.1%, a difference of 0.52%), Yuman (84.0%, a difference of 0.57%), and Mexican American Indian (83.0%, a difference of 0.59%).
| Demographics | Rating | Rank | High School Diploma |
| Belizeans | 0.0 /100 | #316 | Tragic 84.3% |
| Immigrants | Caribbean | 0.0 /100 | #317 | Tragic 84.3% |
| Immigrants | Belize | 0.0 /100 | #318 | Tragic 84.2% |
| Central American Indians | 0.0 /100 | #319 | Tragic 84.2% |
| Nicaraguans | 0.0 /100 | #320 | Tragic 84.1% |
| Yuman | 0.0 /100 | #321 | Tragic 84.0% |
| Lumbee | 0.0 /100 | #322 | Tragic 83.6% |
| Immigrants | Cuba | 0.0 /100 | #323 | Tragic 83.5% |
| Immigrants | Cabo Verde | 0.0 /100 | #324 | Tragic 83.3% |
| Immigrants | Nicaragua | 0.0 /100 | #325 | Tragic 83.1% |
| Mexican American Indians | 0.0 /100 | #326 | Tragic 83.0% |
| Hondurans | 0.0 /100 | #327 | Tragic 83.0% |
| Dominicans | 0.0 /100 | #328 | Tragic 82.9% |
| Hispanics or Latinos | 0.0 /100 | #329 | Tragic 82.9% |
| Immigrants | Azores | 0.0 /100 | #330 | Tragic 82.8% |