Macedonian vs Immigrants from Cuba High School Diploma
COMPARE
Macedonian
Immigrants from Cuba
High School Diploma
High School Diploma Comparison
Macedonians
Immigrants from Cuba
91.1%
HIGH SCHOOL DIPLOMA
99.7/ 100
METRIC RATING
54th/ 347
METRIC RANK
83.5%
HIGH SCHOOL DIPLOMA
0.0/ 100
METRIC RATING
323rd/ 347
METRIC RANK
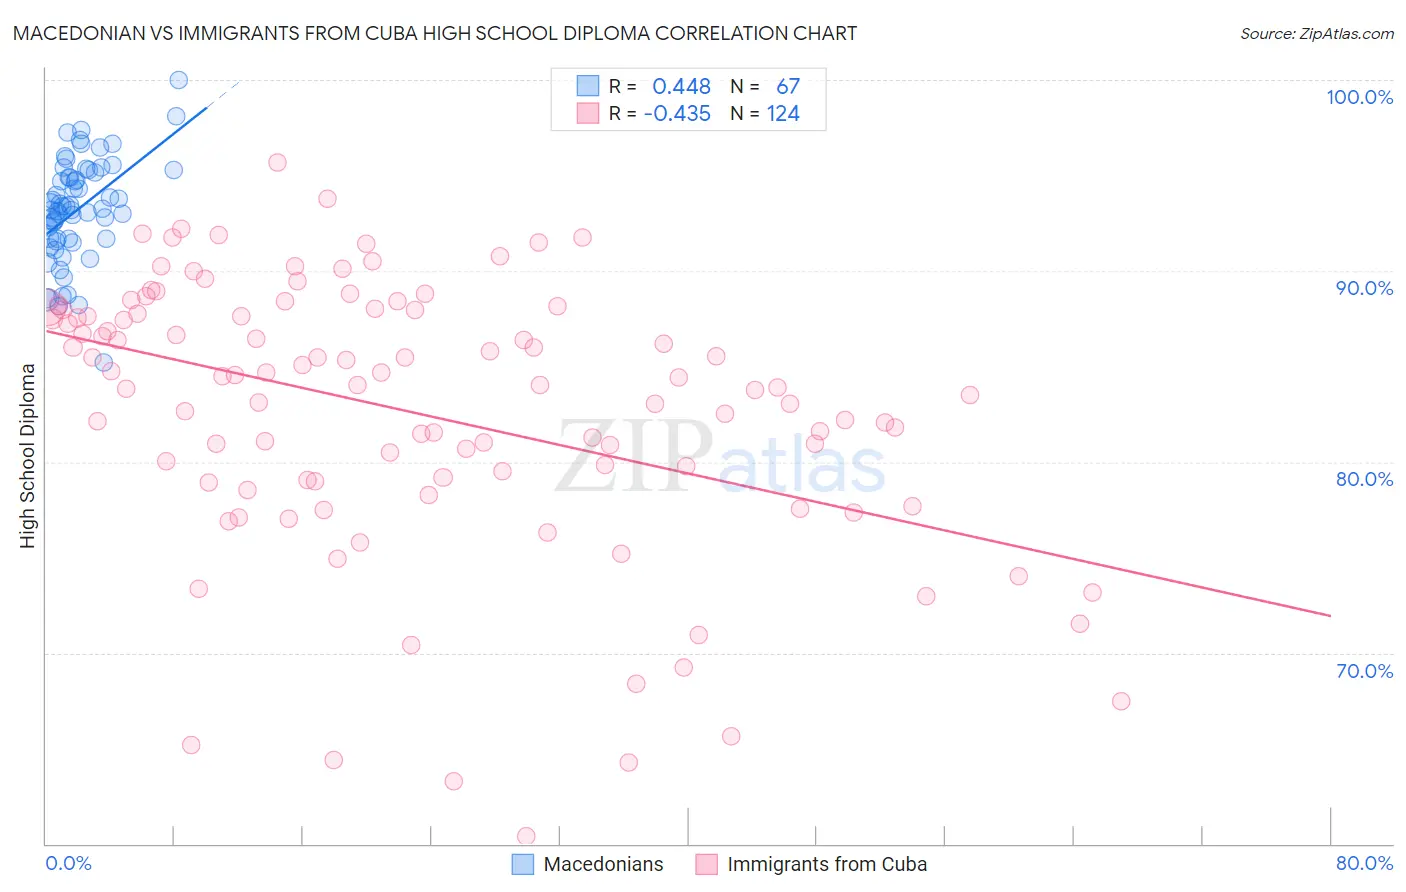
Macedonian vs Immigrants from Cuba High School Diploma Correlation Chart
The statistical analysis conducted on geographies consisting of 132,645,902 people shows a moderate positive correlation between the proportion of Macedonians and percentage of population with at least high school diploma education in the United States with a correlation coefficient (R) of 0.448 and weighted average of 91.1%. Similarly, the statistical analysis conducted on geographies consisting of 326,028,082 people shows a moderate negative correlation between the proportion of Immigrants from Cuba and percentage of population with at least high school diploma education in the United States with a correlation coefficient (R) of -0.435 and weighted average of 83.5%, a difference of 9.1%.
High School Diploma Correlation Summary
| Measurement | Macedonian | Immigrants from Cuba |
| Minimum | 85.2% | 60.4% |
| Maximum | 100.0% | 95.7% |
| Range | 14.8% | 35.2% |
| Mean | 93.2% | 82.6% |
| Median | 93.3% | 84.0% |
| Interquartile 25% (IQ1) | 91.7% | 79.0% |
| Interquartile 75% (IQ3) | 95.1% | 87.9% |
| Interquartile Range (IQR) | 3.5% | 8.8% |
| Standard Deviation (Sample) | 2.7% | 7.1% |
| Standard Deviation (Population) | 2.7% | 7.1% |
Similar Demographics by High School Diploma
Demographics Similar to Macedonians by High School Diploma
In terms of high school diploma, the demographic groups most similar to Macedonians are Serbian (91.1%, a difference of 0.010%), New Zealander (91.1%, a difference of 0.020%), Immigrants from Sweden (91.1%, a difference of 0.020%), Immigrants from Belgium (91.1%, a difference of 0.020%), and Immigrants from Canada (91.1%, a difference of 0.040%).
| Demographics | Rating | Rank | High School Diploma |
| Australians | 99.8 /100 | #47 | Exceptional 91.2% |
| Belgians | 99.8 /100 | #48 | Exceptional 91.2% |
| Bhutanese | 99.8 /100 | #49 | Exceptional 91.2% |
| Welsh | 99.8 /100 | #50 | Exceptional 91.2% |
| New Zealanders | 99.7 /100 | #51 | Exceptional 91.1% |
| Immigrants | Sweden | 99.7 /100 | #52 | Exceptional 91.1% |
| Immigrants | Belgium | 99.7 /100 | #53 | Exceptional 91.1% |
| Macedonians | 99.7 /100 | #54 | Exceptional 91.1% |
| Serbians | 99.7 /100 | #55 | Exceptional 91.1% |
| Immigrants | Canada | 99.7 /100 | #56 | Exceptional 91.1% |
| Zimbabweans | 99.7 /100 | #57 | Exceptional 91.1% |
| Slavs | 99.7 /100 | #58 | Exceptional 91.0% |
| Immigrants | North America | 99.7 /100 | #59 | Exceptional 91.0% |
| Immigrants | Japan | 99.6 /100 | #60 | Exceptional 91.0% |
| Immigrants | Taiwan | 99.6 /100 | #61 | Exceptional 91.0% |
Demographics Similar to Immigrants from Cuba by High School Diploma
In terms of high school diploma, the demographic groups most similar to Immigrants from Cuba are Lumbee (83.6%, a difference of 0.16%), Immigrants from Cabo Verde (83.3%, a difference of 0.29%), Immigrants from Nicaragua (83.1%, a difference of 0.52%), Yuman (84.0%, a difference of 0.57%), and Mexican American Indian (83.0%, a difference of 0.59%).
| Demographics | Rating | Rank | High School Diploma |
| Belizeans | 0.0 /100 | #316 | Tragic 84.3% |
| Immigrants | Caribbean | 0.0 /100 | #317 | Tragic 84.3% |
| Immigrants | Belize | 0.0 /100 | #318 | Tragic 84.2% |
| Central American Indians | 0.0 /100 | #319 | Tragic 84.2% |
| Nicaraguans | 0.0 /100 | #320 | Tragic 84.1% |
| Yuman | 0.0 /100 | #321 | Tragic 84.0% |
| Lumbee | 0.0 /100 | #322 | Tragic 83.6% |
| Immigrants | Cuba | 0.0 /100 | #323 | Tragic 83.5% |
| Immigrants | Cabo Verde | 0.0 /100 | #324 | Tragic 83.3% |
| Immigrants | Nicaragua | 0.0 /100 | #325 | Tragic 83.1% |
| Mexican American Indians | 0.0 /100 | #326 | Tragic 83.0% |
| Hondurans | 0.0 /100 | #327 | Tragic 83.0% |
| Dominicans | 0.0 /100 | #328 | Tragic 82.9% |
| Hispanics or Latinos | 0.0 /100 | #329 | Tragic 82.9% |
| Immigrants | Azores | 0.0 /100 | #330 | Tragic 82.8% |