Cypriot vs Immigrants from Cuba High School Diploma
COMPARE
Cypriot
Immigrants from Cuba
High School Diploma
High School Diploma Comparison
Cypriots
Immigrants from Cuba
91.5%
HIGH SCHOOL DIPLOMA
99.9/ 100
METRIC RATING
27th/ 347
METRIC RANK
83.5%
HIGH SCHOOL DIPLOMA
0.0/ 100
METRIC RATING
323rd/ 347
METRIC RANK
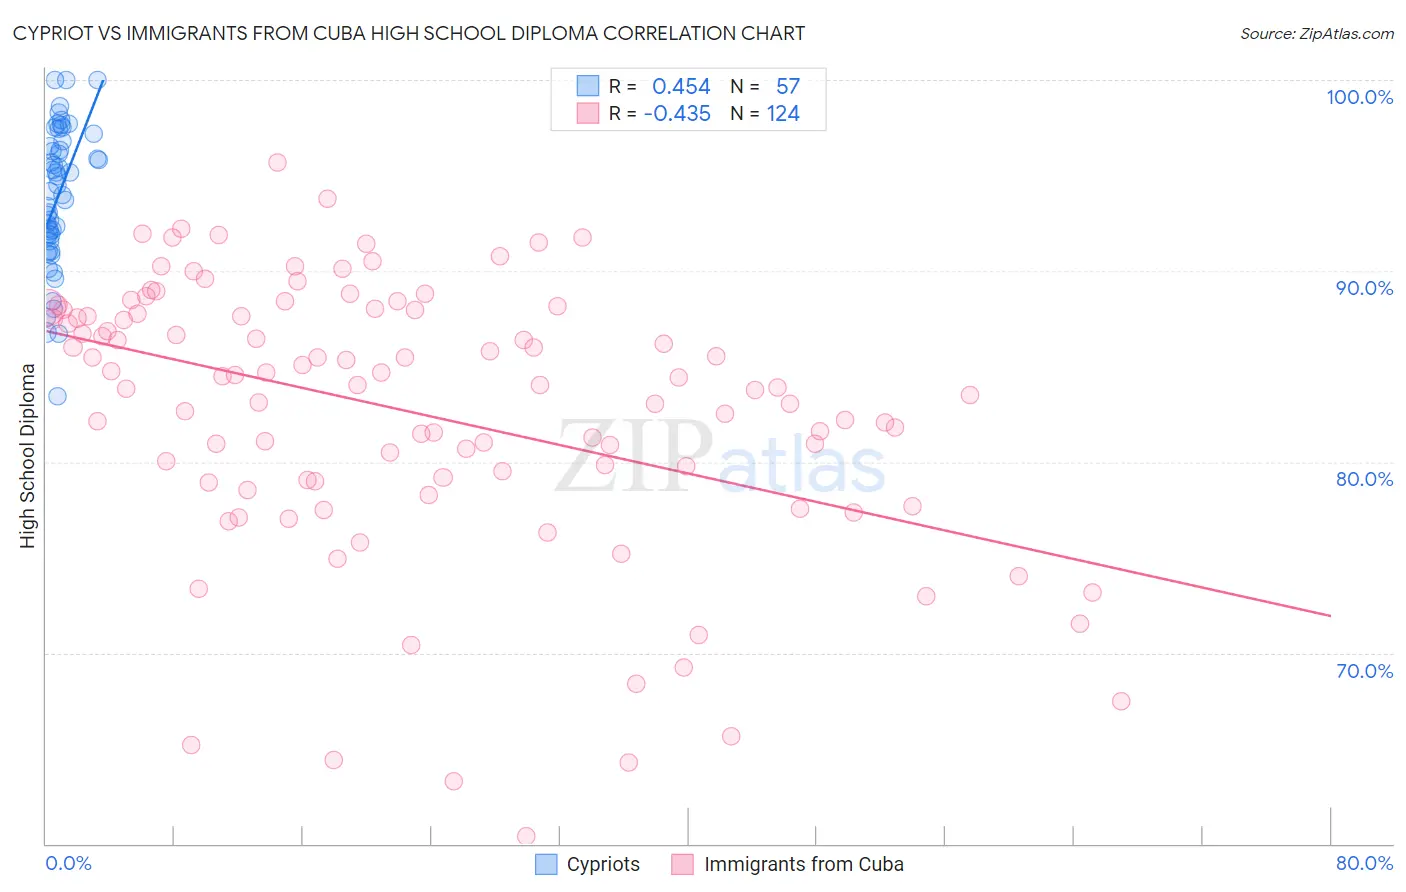
Cypriot vs Immigrants from Cuba High School Diploma Correlation Chart
The statistical analysis conducted on geographies consisting of 61,870,289 people shows a moderate positive correlation between the proportion of Cypriots and percentage of population with at least high school diploma education in the United States with a correlation coefficient (R) of 0.454 and weighted average of 91.5%. Similarly, the statistical analysis conducted on geographies consisting of 326,028,082 people shows a moderate negative correlation between the proportion of Immigrants from Cuba and percentage of population with at least high school diploma education in the United States with a correlation coefficient (R) of -0.435 and weighted average of 83.5%, a difference of 9.5%.
High School Diploma Correlation Summary
| Measurement | Cypriot | Immigrants from Cuba |
| Minimum | 83.4% | 60.4% |
| Maximum | 100.0% | 95.7% |
| Range | 16.6% | 35.2% |
| Mean | 93.9% | 82.6% |
| Median | 94.2% | 84.0% |
| Interquartile 25% (IQ1) | 91.7% | 79.0% |
| Interquartile 75% (IQ3) | 96.7% | 87.9% |
| Interquartile Range (IQR) | 5.0% | 8.8% |
| Standard Deviation (Sample) | 3.7% | 7.1% |
| Standard Deviation (Population) | 3.6% | 7.1% |
Similar Demographics by High School Diploma
Demographics Similar to Cypriots by High School Diploma
In terms of high school diploma, the demographic groups most similar to Cypriots are Russian (91.5%, a difference of 0.010%), Tlingit-Haida (91.4%, a difference of 0.030%), European (91.4%, a difference of 0.050%), Thai (91.5%, a difference of 0.060%), and Iranian (91.4%, a difference of 0.060%).
| Demographics | Rating | Rank | High School Diploma |
| Czechs | 99.9 /100 | #20 | Exceptional 91.6% |
| Filipinos | 99.9 /100 | #21 | Exceptional 91.6% |
| Estonians | 99.9 /100 | #22 | Exceptional 91.6% |
| Scandinavians | 99.9 /100 | #23 | Exceptional 91.5% |
| Italians | 99.9 /100 | #24 | Exceptional 91.5% |
| Thais | 99.9 /100 | #25 | Exceptional 91.5% |
| Russians | 99.9 /100 | #26 | Exceptional 91.5% |
| Cypriots | 99.9 /100 | #27 | Exceptional 91.5% |
| Tlingit-Haida | 99.9 /100 | #28 | Exceptional 91.4% |
| Europeans | 99.9 /100 | #29 | Exceptional 91.4% |
| Iranians | 99.9 /100 | #30 | Exceptional 91.4% |
| Immigrants | Northern Europe | 99.9 /100 | #31 | Exceptional 91.4% |
| English | 99.9 /100 | #32 | Exceptional 91.4% |
| Okinawans | 99.9 /100 | #33 | Exceptional 91.4% |
| Scottish | 99.9 /100 | #34 | Exceptional 91.4% |
Demographics Similar to Immigrants from Cuba by High School Diploma
In terms of high school diploma, the demographic groups most similar to Immigrants from Cuba are Lumbee (83.6%, a difference of 0.16%), Immigrants from Cabo Verde (83.3%, a difference of 0.29%), Immigrants from Nicaragua (83.1%, a difference of 0.52%), Yuman (84.0%, a difference of 0.57%), and Mexican American Indian (83.0%, a difference of 0.59%).
| Demographics | Rating | Rank | High School Diploma |
| Belizeans | 0.0 /100 | #316 | Tragic 84.3% |
| Immigrants | Caribbean | 0.0 /100 | #317 | Tragic 84.3% |
| Immigrants | Belize | 0.0 /100 | #318 | Tragic 84.2% |
| Central American Indians | 0.0 /100 | #319 | Tragic 84.2% |
| Nicaraguans | 0.0 /100 | #320 | Tragic 84.1% |
| Yuman | 0.0 /100 | #321 | Tragic 84.0% |
| Lumbee | 0.0 /100 | #322 | Tragic 83.6% |
| Immigrants | Cuba | 0.0 /100 | #323 | Tragic 83.5% |
| Immigrants | Cabo Verde | 0.0 /100 | #324 | Tragic 83.3% |
| Immigrants | Nicaragua | 0.0 /100 | #325 | Tragic 83.1% |
| Mexican American Indians | 0.0 /100 | #326 | Tragic 83.0% |
| Hondurans | 0.0 /100 | #327 | Tragic 83.0% |
| Dominicans | 0.0 /100 | #328 | Tragic 82.9% |
| Hispanics or Latinos | 0.0 /100 | #329 | Tragic 82.9% |
| Immigrants | Azores | 0.0 /100 | #330 | Tragic 82.8% |