West Indian vs African 12th Grade, No Diploma
COMPARE
West Indian
African
12th Grade, No Diploma
12th Grade, No Diploma Comparison
West Indians
Africans
89.3%
12TH GRADE, NO DIPLOMA
0.2/ 100
METRIC RATING
267th/ 347
METRIC RANK
89.6%
12TH GRADE, NO DIPLOMA
0.4/ 100
METRIC RATING
258th/ 347
METRIC RANK
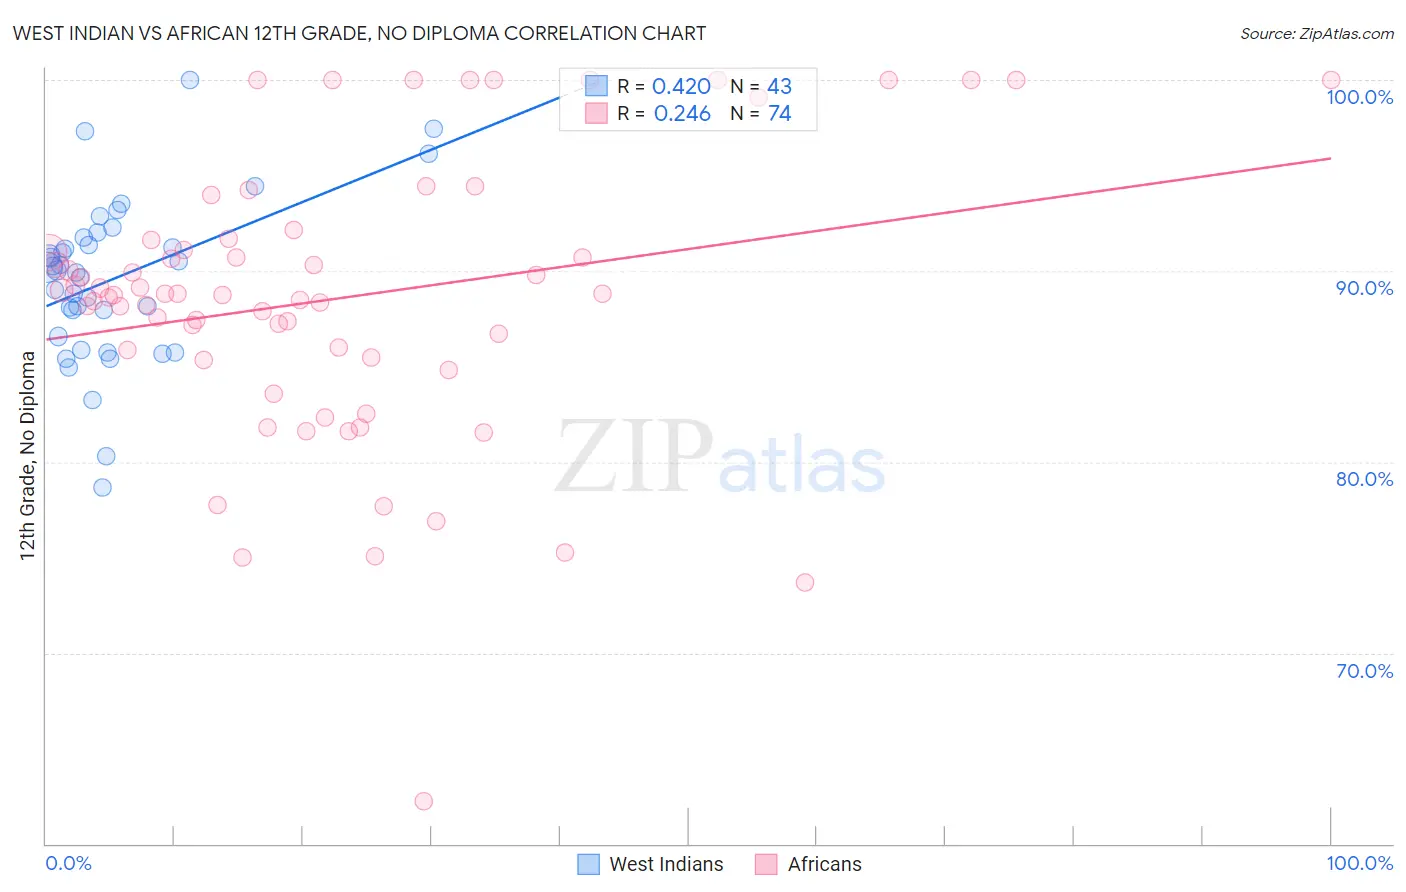
West Indian vs African 12th Grade, No Diploma Correlation Chart
The statistical analysis conducted on geographies consisting of 254,059,006 people shows a moderate positive correlation between the proportion of West Indians and percentage of population with at least 12th grade (no diploma) education in the United States with a correlation coefficient (R) of 0.420 and weighted average of 89.3%. Similarly, the statistical analysis conducted on geographies consisting of 470,094,658 people shows a weak positive correlation between the proportion of Africans and percentage of population with at least 12th grade (no diploma) education in the United States with a correlation coefficient (R) of 0.246 and weighted average of 89.6%, a difference of 0.32%.
12th Grade, No Diploma Correlation Summary
| Measurement | West Indian | African |
| Minimum | 78.6% | 62.2% |
| Maximum | 100.0% | 100.0% |
| Range | 21.4% | 37.8% |
| Mean | 89.6% | 88.6% |
| Median | 90.0% | 88.8% |
| Interquartile 25% (IQ1) | 86.6% | 85.4% |
| Interquartile 75% (IQ3) | 91.7% | 91.6% |
| Interquartile Range (IQR) | 5.1% | 6.2% |
| Standard Deviation (Sample) | 4.2% | 7.4% |
| Standard Deviation (Population) | 4.2% | 7.3% |
Demographics Similar to West Indians and Africans by 12th Grade, No Diploma
In terms of 12th grade, no diploma, the demographic groups most similar to West Indians are Seminole (89.4%, a difference of 0.010%), Immigrants from Trinidad and Tobago (89.3%, a difference of 0.020%), U.S. Virgin Islander (89.3%, a difference of 0.060%), Trinidadian and Tobagonian (89.4%, a difference of 0.080%), and Sri Lankan (89.4%, a difference of 0.090%). Similarly, the demographic groups most similar to Africans are Immigrants from Western Africa (89.6%, a difference of 0.020%), Immigrants from South Eastern Asia (89.6%, a difference of 0.040%), Cheyenne (89.6%, a difference of 0.040%), Sioux (89.6%, a difference of 0.040%), and Immigrants from Ghana (89.7%, a difference of 0.050%).
| Demographics | Rating | Rank | 12th Grade, No Diploma |
| Bahamians | 0.9 /100 | #252 | Tragic 89.9% |
| Choctaw | 0.7 /100 | #253 | Tragic 89.8% |
| Immigrants | Peru | 0.5 /100 | #254 | Tragic 89.7% |
| Immigrants | Senegal | 0.5 /100 | #255 | Tragic 89.7% |
| Immigrants | Ghana | 0.5 /100 | #256 | Tragic 89.7% |
| Jamaicans | 0.5 /100 | #257 | Tragic 89.7% |
| Africans | 0.4 /100 | #258 | Tragic 89.6% |
| Immigrants | Western Africa | 0.4 /100 | #259 | Tragic 89.6% |
| Immigrants | South Eastern Asia | 0.4 /100 | #260 | Tragic 89.6% |
| Cheyenne | 0.4 /100 | #261 | Tragic 89.6% |
| Sioux | 0.4 /100 | #262 | Tragic 89.6% |
| Immigrants | Jamaica | 0.2 /100 | #263 | Tragic 89.5% |
| Sri Lankans | 0.2 /100 | #264 | Tragic 89.4% |
| Trinidadians and Tobagonians | 0.2 /100 | #265 | Tragic 89.4% |
| Seminole | 0.2 /100 | #266 | Tragic 89.4% |
| West Indians | 0.2 /100 | #267 | Tragic 89.3% |
| Immigrants | Trinidad and Tobago | 0.1 /100 | #268 | Tragic 89.3% |
| U.S. Virgin Islanders | 0.1 /100 | #269 | Tragic 89.3% |
| Bangladeshis | 0.1 /100 | #270 | Tragic 89.3% |
| Blacks/African Americans | 0.1 /100 | #271 | Tragic 89.3% |
| Malaysians | 0.1 /100 | #272 | Tragic 89.2% |