Mexican vs Guamanian/Chamorro College, Under 1 year
COMPARE
Mexican
Guamanian/Chamorro
College, Under 1 year
College, Under 1 year Comparison
Mexicans
Guamanians/Chamorros
55.6%
COLLEGE, UNDER 1 YEAR
0.0/ 100
METRIC RATING
330th/ 347
METRIC RANK
65.4%
COLLEGE, UNDER 1 YEAR
48.2/ 100
METRIC RATING
179th/ 347
METRIC RANK
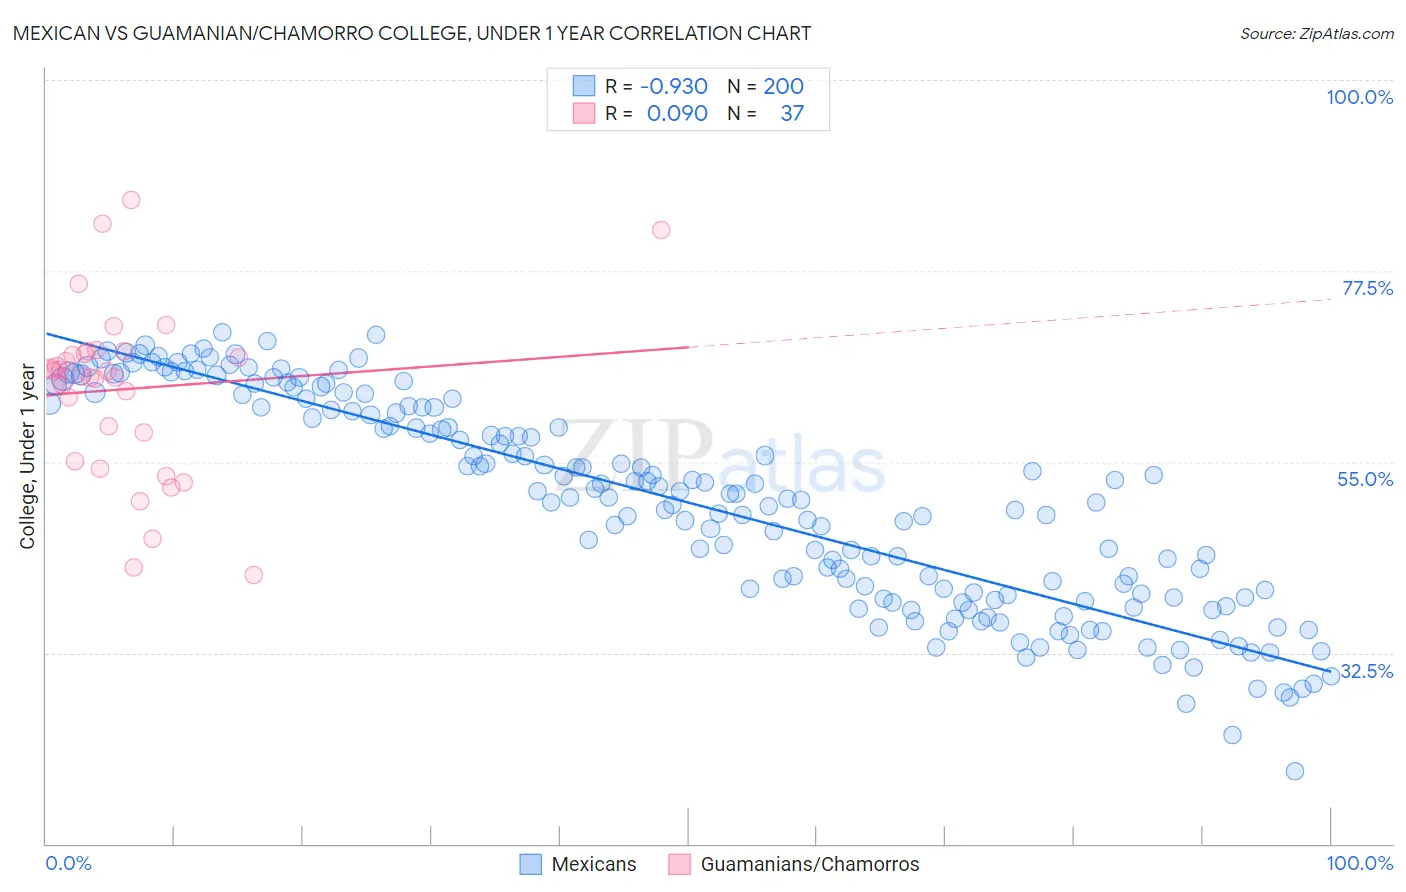
Mexican vs Guamanian/Chamorro College, Under 1 year Correlation Chart
The statistical analysis conducted on geographies consisting of 565,321,978 people shows a near-perfect negative correlation between the proportion of Mexicans and percentage of population with at least college, under 1 year education in the United States with a correlation coefficient (R) of -0.930 and weighted average of 55.6%. Similarly, the statistical analysis conducted on geographies consisting of 221,965,438 people shows a slight positive correlation between the proportion of Guamanians/Chamorros and percentage of population with at least college, under 1 year education in the United States with a correlation coefficient (R) of 0.090 and weighted average of 65.4%, a difference of 17.5%.
College, Under 1 year Correlation Summary
| Measurement | Mexican | Guamanian/Chamorro |
| Minimum | 18.5% | 41.7% |
| Maximum | 70.3% | 85.9% |
| Range | 51.8% | 44.2% |
| Mean | 50.2% | 63.6% |
| Median | 51.0% | 65.1% |
| Interquartile 25% (IQ1) | 39.2% | 56.8% |
| Interquartile 75% (IQ3) | 61.5% | 67.9% |
| Interquartile Range (IQR) | 22.3% | 11.1% |
| Standard Deviation (Sample) | 12.4% | 10.0% |
| Standard Deviation (Population) | 12.4% | 9.9% |
Similar Demographics by College, Under 1 year
Demographics Similar to Mexicans by College, Under 1 year
In terms of college, under 1 year, the demographic groups most similar to Mexicans are Immigrants from Cuba (55.7%, a difference of 0.13%), Dominican (55.5%, a difference of 0.26%), Immigrants from Yemen (55.3%, a difference of 0.67%), Cape Verdean (56.0%, a difference of 0.75%), and Yuman (55.1%, a difference of 0.99%).
| Demographics | Rating | Rank | College, Under 1 year |
| Immigrants | Honduras | 0.0 /100 | #323 | Tragic 56.5% |
| Immigrants | El Salvador | 0.0 /100 | #324 | Tragic 56.4% |
| Immigrants | Latin America | 0.0 /100 | #325 | Tragic 56.3% |
| Navajo | 0.0 /100 | #326 | Tragic 56.3% |
| Immigrants | Guatemala | 0.0 /100 | #327 | Tragic 56.2% |
| Cape Verdeans | 0.0 /100 | #328 | Tragic 56.0% |
| Immigrants | Cuba | 0.0 /100 | #329 | Tragic 55.7% |
| Mexicans | 0.0 /100 | #330 | Tragic 55.6% |
| Dominicans | 0.0 /100 | #331 | Tragic 55.5% |
| Immigrants | Yemen | 0.0 /100 | #332 | Tragic 55.3% |
| Yuman | 0.0 /100 | #333 | Tragic 55.1% |
| Immigrants | Azores | 0.0 /100 | #334 | Tragic 54.7% |
| Inupiat | 0.0 /100 | #335 | Tragic 54.6% |
| Pennsylvania Germans | 0.0 /100 | #336 | Tragic 54.5% |
| Immigrants | Central America | 0.0 /100 | #337 | Tragic 54.4% |
Demographics Similar to Guamanians/Chamorros by College, Under 1 year
In terms of college, under 1 year, the demographic groups most similar to Guamanians/Chamorros are German Russian (65.4%, a difference of 0.0%), Immigrants from North Macedonia (65.4%, a difference of 0.020%), French (65.4%, a difference of 0.030%), Scotch-Irish (65.4%, a difference of 0.060%), and Immigrants from Bosnia and Herzegovina (65.4%, a difference of 0.080%).
| Demographics | Rating | Rank | College, Under 1 year |
| South American Indians | 54.4 /100 | #172 | Average 65.5% |
| Swiss | 53.9 /100 | #173 | Average 65.5% |
| Immigrants | Bosnia and Herzegovina | 50.0 /100 | #174 | Average 65.4% |
| Scotch-Irish | 49.5 /100 | #175 | Average 65.4% |
| French | 48.9 /100 | #176 | Average 65.4% |
| Immigrants | North Macedonia | 48.6 /100 | #177 | Average 65.4% |
| German Russians | 48.3 /100 | #178 | Average 65.4% |
| Guamanians/Chamorros | 48.2 /100 | #179 | Average 65.4% |
| Dutch | 46.1 /100 | #180 | Average 65.3% |
| Spaniards | 45.5 /100 | #181 | Average 65.3% |
| Immigrants | Africa | 44.7 /100 | #182 | Average 65.3% |
| Immigrants | Poland | 42.6 /100 | #183 | Average 65.2% |
| Bermudans | 42.0 /100 | #184 | Average 65.2% |
| Sri Lankans | 41.7 /100 | #185 | Average 65.2% |
| Immigrants | Sierra Leone | 39.7 /100 | #186 | Fair 65.1% |