Sierra Leonean vs Guamanian/Chamorro College, Under 1 year
COMPARE
Sierra Leonean
Guamanian/Chamorro
College, Under 1 year
College, Under 1 year Comparison
Sierra Leoneans
Guamanians/Chamorros
66.0%
COLLEGE, UNDER 1 YEAR
67.8/ 100
METRIC RATING
157th/ 347
METRIC RANK
65.4%
COLLEGE, UNDER 1 YEAR
48.2/ 100
METRIC RATING
179th/ 347
METRIC RANK
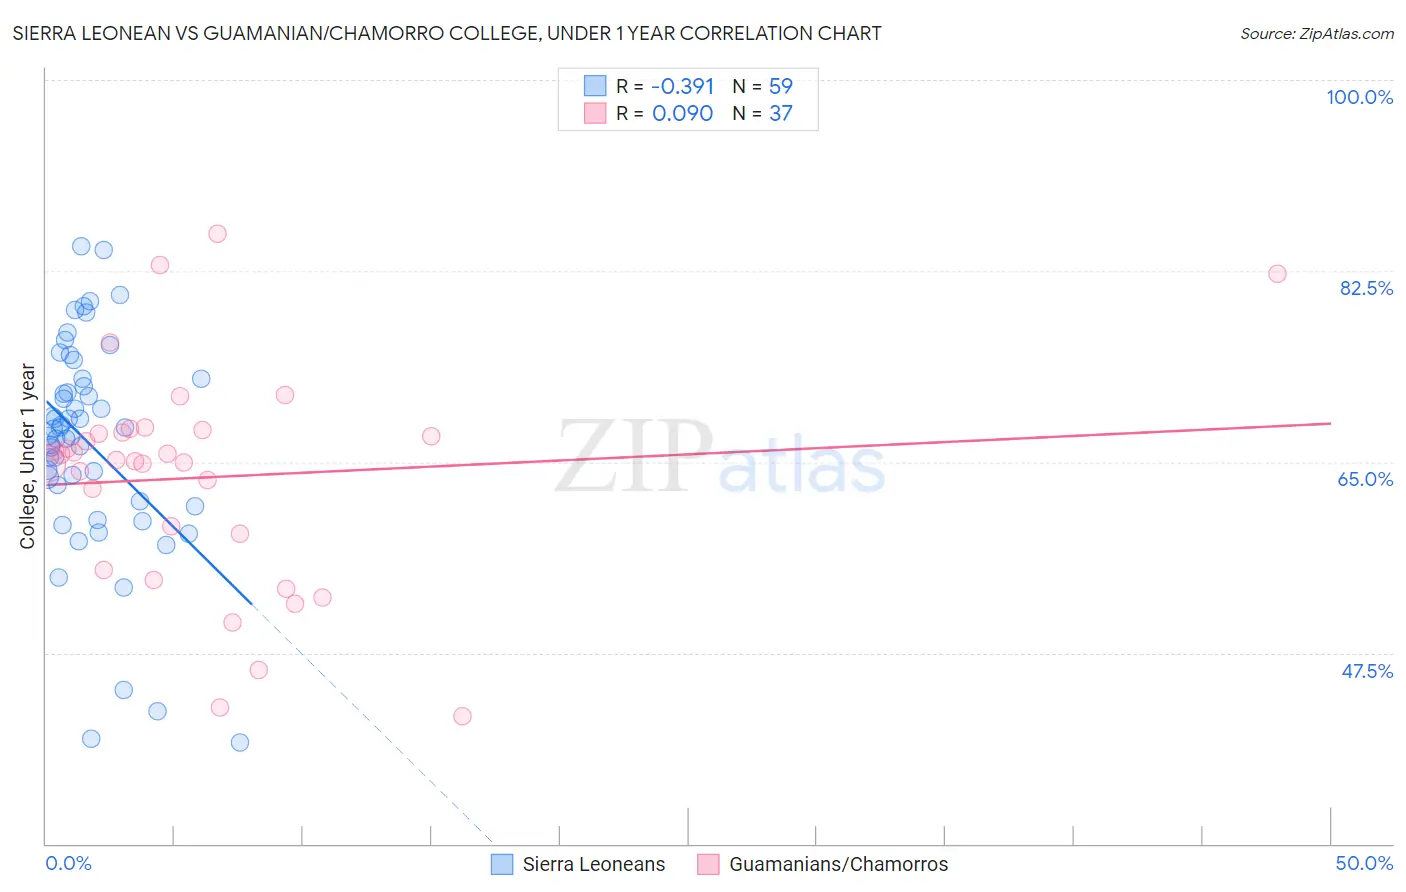
Sierra Leonean vs Guamanian/Chamorro College, Under 1 year Correlation Chart
The statistical analysis conducted on geographies consisting of 83,362,711 people shows a mild negative correlation between the proportion of Sierra Leoneans and percentage of population with at least college, under 1 year education in the United States with a correlation coefficient (R) of -0.391 and weighted average of 66.0%. Similarly, the statistical analysis conducted on geographies consisting of 221,965,438 people shows a slight positive correlation between the proportion of Guamanians/Chamorros and percentage of population with at least college, under 1 year education in the United States with a correlation coefficient (R) of 0.090 and weighted average of 65.4%, a difference of 0.90%.
College, Under 1 year Correlation Summary
| Measurement | Sierra Leonean | Guamanian/Chamorro |
| Minimum | 39.3% | 41.7% |
| Maximum | 84.7% | 85.9% |
| Range | 45.5% | 44.2% |
| Mean | 66.7% | 63.6% |
| Median | 68.1% | 65.1% |
| Interquartile 25% (IQ1) | 61.4% | 56.8% |
| Interquartile 75% (IQ3) | 72.6% | 67.9% |
| Interquartile Range (IQR) | 11.2% | 11.1% |
| Standard Deviation (Sample) | 9.9% | 10.0% |
| Standard Deviation (Population) | 9.8% | 9.9% |
Similar Demographics by College, Under 1 year
Demographics Similar to Sierra Leoneans by College, Under 1 year
In terms of college, under 1 year, the demographic groups most similar to Sierra Leoneans are Celtic (65.9%, a difference of 0.030%), Tlingit-Haida (65.9%, a difference of 0.070%), Albanian (65.9%, a difference of 0.080%), Brazilian (65.9%, a difference of 0.090%), and Welsh (66.0%, a difference of 0.10%).
| Demographics | Rating | Rank | College, Under 1 year |
| Immigrants | Iraq | 77.1 /100 | #150 | Good 66.3% |
| Immigrants | Sudan | 76.0 /100 | #151 | Good 66.2% |
| Sudanese | 74.1 /100 | #152 | Good 66.2% |
| Belgians | 73.7 /100 | #153 | Good 66.2% |
| Immigrants | Eritrea | 71.9 /100 | #154 | Good 66.1% |
| Irish | 70.3 /100 | #155 | Good 66.0% |
| Welsh | 69.9 /100 | #156 | Good 66.0% |
| Sierra Leoneans | 67.8 /100 | #157 | Good 66.0% |
| Celtics | 67.3 /100 | #158 | Good 65.9% |
| Tlingit-Haida | 66.4 /100 | #159 | Good 65.9% |
| Albanians | 66.1 /100 | #160 | Good 65.9% |
| Brazilians | 66.0 /100 | #161 | Good 65.9% |
| Koreans | 65.3 /100 | #162 | Good 65.9% |
| Somalis | 62.7 /100 | #163 | Good 65.8% |
| Czechoslovakians | 62.6 /100 | #164 | Good 65.8% |
Demographics Similar to Guamanians/Chamorros by College, Under 1 year
In terms of college, under 1 year, the demographic groups most similar to Guamanians/Chamorros are German Russian (65.4%, a difference of 0.0%), Immigrants from North Macedonia (65.4%, a difference of 0.020%), French (65.4%, a difference of 0.030%), Scotch-Irish (65.4%, a difference of 0.060%), and Immigrants from Bosnia and Herzegovina (65.4%, a difference of 0.080%).
| Demographics | Rating | Rank | College, Under 1 year |
| South American Indians | 54.4 /100 | #172 | Average 65.5% |
| Swiss | 53.9 /100 | #173 | Average 65.5% |
| Immigrants | Bosnia and Herzegovina | 50.0 /100 | #174 | Average 65.4% |
| Scotch-Irish | 49.5 /100 | #175 | Average 65.4% |
| French | 48.9 /100 | #176 | Average 65.4% |
| Immigrants | North Macedonia | 48.6 /100 | #177 | Average 65.4% |
| German Russians | 48.3 /100 | #178 | Average 65.4% |
| Guamanians/Chamorros | 48.2 /100 | #179 | Average 65.4% |
| Dutch | 46.1 /100 | #180 | Average 65.3% |
| Spaniards | 45.5 /100 | #181 | Average 65.3% |
| Immigrants | Africa | 44.7 /100 | #182 | Average 65.3% |
| Immigrants | Poland | 42.6 /100 | #183 | Average 65.2% |
| Bermudans | 42.0 /100 | #184 | Average 65.2% |
| Sri Lankans | 41.7 /100 | #185 | Average 65.2% |
| Immigrants | Sierra Leone | 39.7 /100 | #186 | Fair 65.1% |