Immigrants from Africa vs Guamanian/Chamorro College, Under 1 year
COMPARE
Immigrants from Africa
Guamanian/Chamorro
College, Under 1 year
College, Under 1 year Comparison
Immigrants from Africa
Guamanians/Chamorros
65.3%
COLLEGE, UNDER 1 YEAR
44.7/ 100
METRIC RATING
182nd/ 347
METRIC RANK
65.4%
COLLEGE, UNDER 1 YEAR
48.2/ 100
METRIC RATING
179th/ 347
METRIC RANK
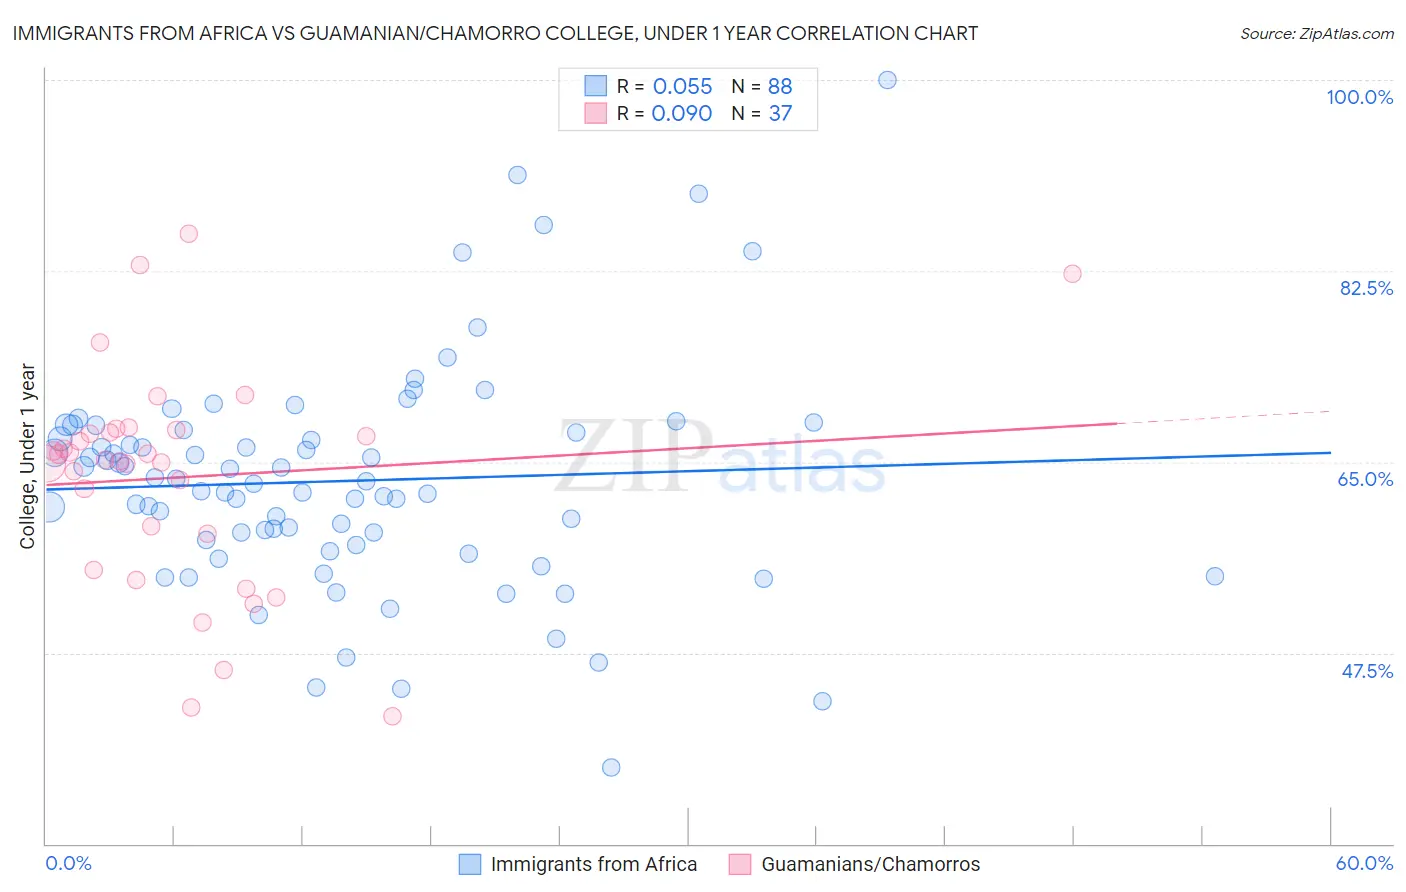
Immigrants from Africa vs Guamanian/Chamorro College, Under 1 year Correlation Chart
The statistical analysis conducted on geographies consisting of 469,444,786 people shows a slight positive correlation between the proportion of Immigrants from Africa and percentage of population with at least college, under 1 year education in the United States with a correlation coefficient (R) of 0.055 and weighted average of 65.3%. Similarly, the statistical analysis conducted on geographies consisting of 221,965,438 people shows a slight positive correlation between the proportion of Guamanians/Chamorros and percentage of population with at least college, under 1 year education in the United States with a correlation coefficient (R) of 0.090 and weighted average of 65.4%, a difference of 0.16%.
College, Under 1 year Correlation Summary
| Measurement | Immigrants from Africa | Guamanian/Chamorro |
| Minimum | 37.0% | 41.7% |
| Maximum | 100.0% | 85.9% |
| Range | 63.0% | 44.2% |
| Mean | 63.2% | 63.6% |
| Median | 63.1% | 65.1% |
| Interquartile 25% (IQ1) | 57.7% | 56.8% |
| Interquartile 75% (IQ3) | 67.9% | 67.9% |
| Interquartile Range (IQR) | 10.2% | 11.1% |
| Standard Deviation (Sample) | 10.4% | 10.0% |
| Standard Deviation (Population) | 10.3% | 9.9% |
Demographics Similar to Immigrants from Africa and Guamanians/Chamorros by College, Under 1 year
In terms of college, under 1 year, the demographic groups most similar to Immigrants from Africa are Spaniard (65.3%, a difference of 0.040%), Dutch (65.3%, a difference of 0.060%), Immigrants from Poland (65.2%, a difference of 0.10%), Bermudan (65.2%, a difference of 0.12%), and Sri Lankan (65.2%, a difference of 0.13%). Similarly, the demographic groups most similar to Guamanians/Chamorros are German Russian (65.4%, a difference of 0.0%), Immigrants from North Macedonia (65.4%, a difference of 0.020%), French (65.4%, a difference of 0.030%), Scotch-Irish (65.4%, a difference of 0.060%), and Immigrants from Bosnia and Herzegovina (65.4%, a difference of 0.080%).
| Demographics | Rating | Rank | College, Under 1 year |
| Germans | 55.7 /100 | #170 | Average 65.6% |
| Immigrants | Oceania | 55.0 /100 | #171 | Average 65.6% |
| South American Indians | 54.4 /100 | #172 | Average 65.5% |
| Swiss | 53.9 /100 | #173 | Average 65.5% |
| Immigrants | Bosnia and Herzegovina | 50.0 /100 | #174 | Average 65.4% |
| Scotch-Irish | 49.5 /100 | #175 | Average 65.4% |
| French | 48.9 /100 | #176 | Average 65.4% |
| Immigrants | North Macedonia | 48.6 /100 | #177 | Average 65.4% |
| German Russians | 48.3 /100 | #178 | Average 65.4% |
| Guamanians/Chamorros | 48.2 /100 | #179 | Average 65.4% |
| Dutch | 46.1 /100 | #180 | Average 65.3% |
| Spaniards | 45.5 /100 | #181 | Average 65.3% |
| Immigrants | Africa | 44.7 /100 | #182 | Average 65.3% |
| Immigrants | Poland | 42.6 /100 | #183 | Average 65.2% |
| Bermudans | 42.0 /100 | #184 | Average 65.2% |
| Sri Lankans | 41.7 /100 | #185 | Average 65.2% |
| Immigrants | Sierra Leone | 39.7 /100 | #186 | Fair 65.1% |
| Immigrants | Southern Europe | 34.3 /100 | #187 | Fair 64.9% |
| Immigrants | Albania | 32.0 /100 | #188 | Fair 64.9% |
| Spanish | 31.6 /100 | #189 | Fair 64.9% |
| Immigrants | Philippines | 30.1 /100 | #190 | Fair 64.8% |