Paiute vs Guamanian/Chamorro College, Under 1 year
COMPARE
Paiute
Guamanian/Chamorro
College, Under 1 year
College, Under 1 year Comparison
Paiute
Guamanians/Chamorros
59.6%
COLLEGE, UNDER 1 YEAR
0.0/ 100
METRIC RATING
285th/ 347
METRIC RANK
65.4%
COLLEGE, UNDER 1 YEAR
48.2/ 100
METRIC RATING
179th/ 347
METRIC RANK
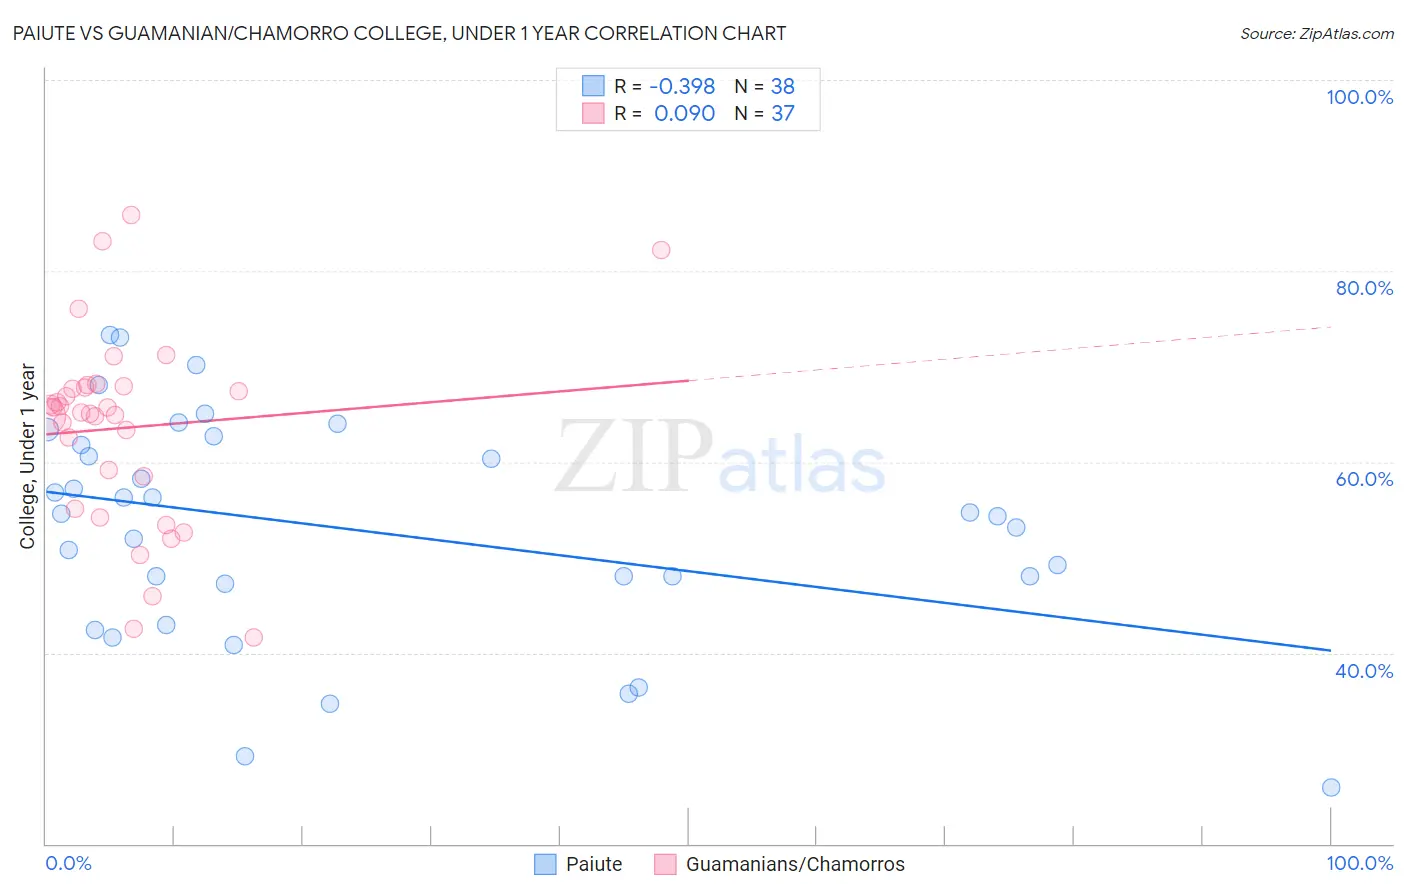
Paiute vs Guamanian/Chamorro College, Under 1 year Correlation Chart
The statistical analysis conducted on geographies consisting of 58,404,248 people shows a mild negative correlation between the proportion of Paiute and percentage of population with at least college, under 1 year education in the United States with a correlation coefficient (R) of -0.398 and weighted average of 59.6%. Similarly, the statistical analysis conducted on geographies consisting of 221,965,438 people shows a slight positive correlation between the proportion of Guamanians/Chamorros and percentage of population with at least college, under 1 year education in the United States with a correlation coefficient (R) of 0.090 and weighted average of 65.4%, a difference of 9.6%.
College, Under 1 year Correlation Summary
| Measurement | Paiute | Guamanian/Chamorro |
| Minimum | 25.9% | 41.7% |
| Maximum | 73.3% | 85.9% |
| Range | 47.4% | 44.2% |
| Mean | 52.9% | 63.6% |
| Median | 54.4% | 65.1% |
| Interquartile 25% (IQ1) | 47.3% | 56.8% |
| Interquartile 75% (IQ3) | 61.8% | 67.9% |
| Interquartile Range (IQR) | 14.5% | 11.1% |
| Standard Deviation (Sample) | 11.7% | 10.0% |
| Standard Deviation (Population) | 11.5% | 9.9% |
Similar Demographics by College, Under 1 year
Demographics Similar to Paiute by College, Under 1 year
In terms of college, under 1 year, the demographic groups most similar to Paiute are Immigrants from St. Vincent and the Grenadines (59.6%, a difference of 0.010%), Immigrants from Jamaica (59.7%, a difference of 0.12%), British West Indian (59.5%, a difference of 0.14%), Sioux (59.4%, a difference of 0.31%), and Black/African American (59.4%, a difference of 0.41%).
| Demographics | Rating | Rank | College, Under 1 year |
| Yaqui | 0.1 /100 | #278 | Tragic 60.2% |
| Ute | 0.1 /100 | #279 | Tragic 60.2% |
| Crow | 0.1 /100 | #280 | Tragic 60.2% |
| Cherokee | 0.1 /100 | #281 | Tragic 60.1% |
| Belizeans | 0.1 /100 | #282 | Tragic 60.1% |
| Immigrants | Jamaica | 0.0 /100 | #283 | Tragic 59.7% |
| Immigrants | St. Vincent and the Grenadines | 0.0 /100 | #284 | Tragic 59.6% |
| Paiute | 0.0 /100 | #285 | Tragic 59.6% |
| British West Indians | 0.0 /100 | #286 | Tragic 59.5% |
| Sioux | 0.0 /100 | #287 | Tragic 59.4% |
| Blacks/African Americans | 0.0 /100 | #288 | Tragic 59.4% |
| Choctaw | 0.0 /100 | #289 | Tragic 59.3% |
| Ecuadorians | 0.0 /100 | #290 | Tragic 59.3% |
| Creek | 0.0 /100 | #291 | Tragic 59.3% |
| Nicaraguans | 0.0 /100 | #292 | Tragic 59.2% |
Demographics Similar to Guamanians/Chamorros by College, Under 1 year
In terms of college, under 1 year, the demographic groups most similar to Guamanians/Chamorros are German Russian (65.4%, a difference of 0.0%), Immigrants from North Macedonia (65.4%, a difference of 0.020%), French (65.4%, a difference of 0.030%), Scotch-Irish (65.4%, a difference of 0.060%), and Immigrants from Bosnia and Herzegovina (65.4%, a difference of 0.080%).
| Demographics | Rating | Rank | College, Under 1 year |
| South American Indians | 54.4 /100 | #172 | Average 65.5% |
| Swiss | 53.9 /100 | #173 | Average 65.5% |
| Immigrants | Bosnia and Herzegovina | 50.0 /100 | #174 | Average 65.4% |
| Scotch-Irish | 49.5 /100 | #175 | Average 65.4% |
| French | 48.9 /100 | #176 | Average 65.4% |
| Immigrants | North Macedonia | 48.6 /100 | #177 | Average 65.4% |
| German Russians | 48.3 /100 | #178 | Average 65.4% |
| Guamanians/Chamorros | 48.2 /100 | #179 | Average 65.4% |
| Dutch | 46.1 /100 | #180 | Average 65.3% |
| Spaniards | 45.5 /100 | #181 | Average 65.3% |
| Immigrants | Africa | 44.7 /100 | #182 | Average 65.3% |
| Immigrants | Poland | 42.6 /100 | #183 | Average 65.2% |
| Bermudans | 42.0 /100 | #184 | Average 65.2% |
| Sri Lankans | 41.7 /100 | #185 | Average 65.2% |
| Immigrants | Sierra Leone | 39.7 /100 | #186 | Fair 65.1% |