Immigrants from Kazakhstan vs Guamanian/Chamorro College, Under 1 year
COMPARE
Immigrants from Kazakhstan
Guamanian/Chamorro
College, Under 1 year
College, Under 1 year Comparison
Immigrants from Kazakhstan
Guamanians/Chamorros
69.2%
COLLEGE, UNDER 1 YEAR
99.5/ 100
METRIC RATING
61st/ 347
METRIC RANK
65.4%
COLLEGE, UNDER 1 YEAR
48.2/ 100
METRIC RATING
179th/ 347
METRIC RANK
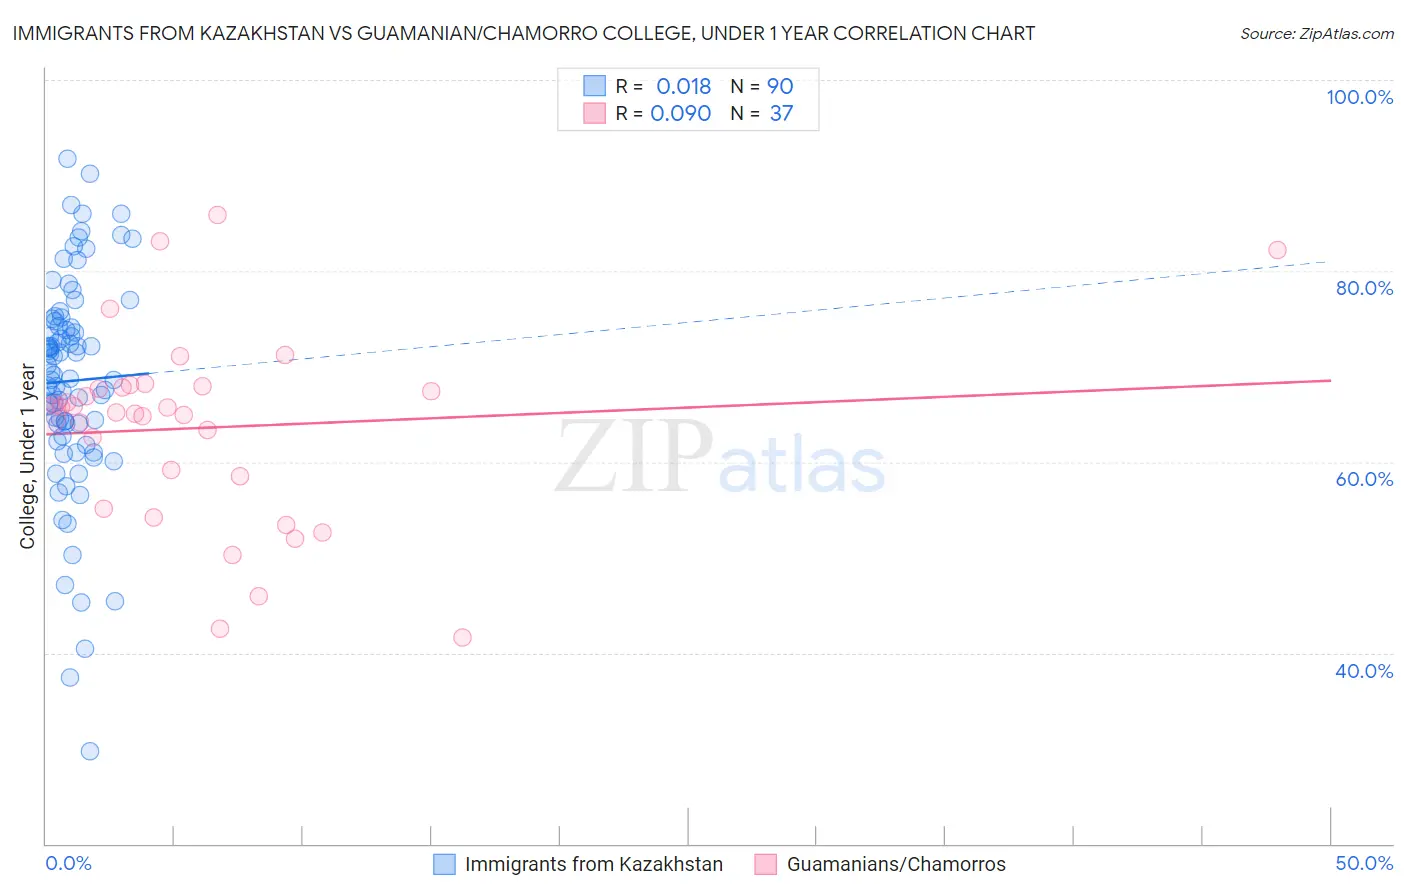
Immigrants from Kazakhstan vs Guamanian/Chamorro College, Under 1 year Correlation Chart
The statistical analysis conducted on geographies consisting of 124,443,390 people shows no correlation between the proportion of Immigrants from Kazakhstan and percentage of population with at least college, under 1 year education in the United States with a correlation coefficient (R) of 0.018 and weighted average of 69.2%. Similarly, the statistical analysis conducted on geographies consisting of 221,965,438 people shows a slight positive correlation between the proportion of Guamanians/Chamorros and percentage of population with at least college, under 1 year education in the United States with a correlation coefficient (R) of 0.090 and weighted average of 65.4%, a difference of 5.8%.
College, Under 1 year Correlation Summary
| Measurement | Immigrants from Kazakhstan | Guamanian/Chamorro |
| Minimum | 29.7% | 41.7% |
| Maximum | 91.8% | 85.9% |
| Range | 62.1% | 44.2% |
| Mean | 68.5% | 63.6% |
| Median | 69.2% | 65.1% |
| Interquartile 25% (IQ1) | 63.9% | 56.8% |
| Interquartile 75% (IQ3) | 74.7% | 67.9% |
| Interquartile Range (IQR) | 10.8% | 11.1% |
| Standard Deviation (Sample) | 11.3% | 10.0% |
| Standard Deviation (Population) | 11.2% | 9.9% |
Similar Demographics by College, Under 1 year
Demographics Similar to Immigrants from Kazakhstan by College, Under 1 year
In terms of college, under 1 year, the demographic groups most similar to Immigrants from Kazakhstan are Immigrants from Belarus (69.2%, a difference of 0.0%), Immigrants from Asia (69.2%, a difference of 0.040%), Immigrants from Serbia (69.3%, a difference of 0.13%), Immigrants from Canada (69.1%, a difference of 0.13%), and Northern European (69.0%, a difference of 0.17%).
| Demographics | Rating | Rank | College, Under 1 year |
| Immigrants | Czechoslovakia | 99.7 /100 | #54 | Exceptional 69.6% |
| Maltese | 99.7 /100 | #55 | Exceptional 69.5% |
| Immigrants | Scotland | 99.6 /100 | #56 | Exceptional 69.4% |
| Asians | 99.6 /100 | #57 | Exceptional 69.4% |
| Immigrants | Malaysia | 99.6 /100 | #58 | Exceptional 69.3% |
| Immigrants | Serbia | 99.5 /100 | #59 | Exceptional 69.3% |
| Immigrants | Asia | 99.5 /100 | #60 | Exceptional 69.2% |
| Immigrants | Kazakhstan | 99.5 /100 | #61 | Exceptional 69.2% |
| Immigrants | Belarus | 99.5 /100 | #62 | Exceptional 69.2% |
| Immigrants | Canada | 99.4 /100 | #63 | Exceptional 69.1% |
| Northern Europeans | 99.4 /100 | #64 | Exceptional 69.0% |
| Immigrants | Moldova | 99.3 /100 | #65 | Exceptional 69.0% |
| Immigrants | North America | 99.3 /100 | #66 | Exceptional 69.0% |
| Immigrants | Zimbabwe | 99.2 /100 | #67 | Exceptional 68.9% |
| Immigrants | Indonesia | 99.2 /100 | #68 | Exceptional 68.9% |
Demographics Similar to Guamanians/Chamorros by College, Under 1 year
In terms of college, under 1 year, the demographic groups most similar to Guamanians/Chamorros are German Russian (65.4%, a difference of 0.0%), Immigrants from North Macedonia (65.4%, a difference of 0.020%), French (65.4%, a difference of 0.030%), Scotch-Irish (65.4%, a difference of 0.060%), and Immigrants from Bosnia and Herzegovina (65.4%, a difference of 0.080%).
| Demographics | Rating | Rank | College, Under 1 year |
| South American Indians | 54.4 /100 | #172 | Average 65.5% |
| Swiss | 53.9 /100 | #173 | Average 65.5% |
| Immigrants | Bosnia and Herzegovina | 50.0 /100 | #174 | Average 65.4% |
| Scotch-Irish | 49.5 /100 | #175 | Average 65.4% |
| French | 48.9 /100 | #176 | Average 65.4% |
| Immigrants | North Macedonia | 48.6 /100 | #177 | Average 65.4% |
| German Russians | 48.3 /100 | #178 | Average 65.4% |
| Guamanians/Chamorros | 48.2 /100 | #179 | Average 65.4% |
| Dutch | 46.1 /100 | #180 | Average 65.3% |
| Spaniards | 45.5 /100 | #181 | Average 65.3% |
| Immigrants | Africa | 44.7 /100 | #182 | Average 65.3% |
| Immigrants | Poland | 42.6 /100 | #183 | Average 65.2% |
| Bermudans | 42.0 /100 | #184 | Average 65.2% |
| Sri Lankans | 41.7 /100 | #185 | Average 65.2% |
| Immigrants | Sierra Leone | 39.7 /100 | #186 | Fair 65.1% |