Marshallese vs Immigrants from Oceania Doctorate Degree
COMPARE
Marshallese
Immigrants from Oceania
Doctorate Degree
Doctorate Degree Comparison
Marshallese
Immigrants from Oceania
1.5%
DOCTORATE DEGREE
0.4/ 100
METRIC RATING
279th/ 347
METRIC RANK
1.9%
DOCTORATE DEGREE
74.0/ 100
METRIC RATING
153rd/ 347
METRIC RANK
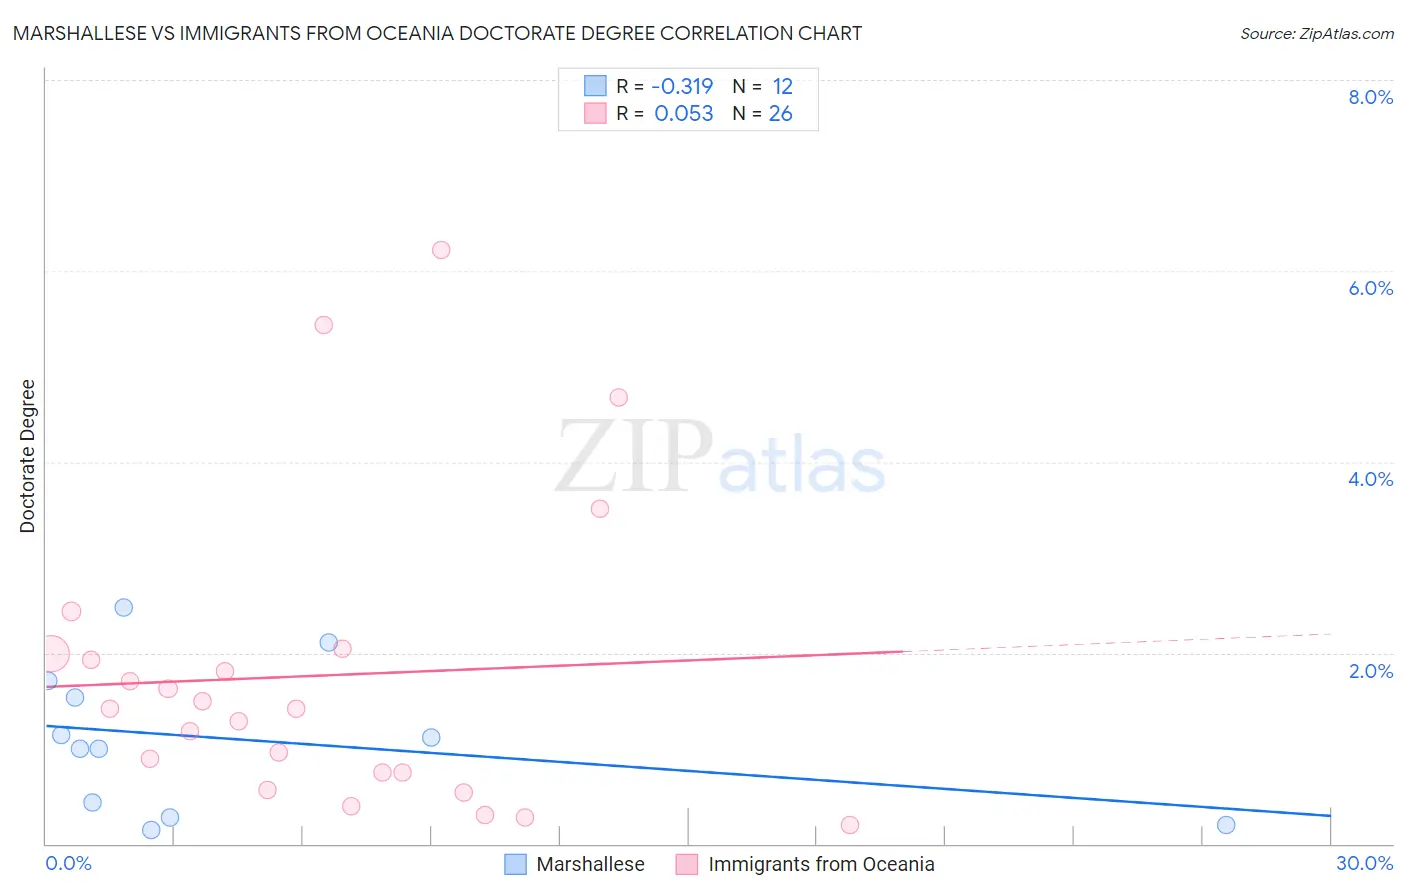
Marshallese vs Immigrants from Oceania Doctorate Degree Correlation Chart
The statistical analysis conducted on geographies consisting of 14,742,598 people shows a mild negative correlation between the proportion of Marshallese and percentage of population with at least doctorate degree education in the United States with a correlation coefficient (R) of -0.319 and weighted average of 1.5%. Similarly, the statistical analysis conducted on geographies consisting of 303,370,290 people shows a slight positive correlation between the proportion of Immigrants from Oceania and percentage of population with at least doctorate degree education in the United States with a correlation coefficient (R) of 0.053 and weighted average of 1.9%, a difference of 30.8%.
Doctorate Degree Correlation Summary
| Measurement | Marshallese | Immigrants from Oceania |
| Minimum | 0.14% | 0.19% |
| Maximum | 2.5% | 6.2% |
| Range | 2.3% | 6.0% |
| Mean | 1.1% | 1.8% |
| Median | 1.1% | 1.4% |
| Interquartile 25% (IQ1) | 0.35% | 0.75% |
| Interquartile 75% (IQ3) | 1.6% | 2.0% |
| Interquartile Range (IQR) | 1.3% | 1.2% |
| Standard Deviation (Sample) | 0.76% | 1.6% |
| Standard Deviation (Population) | 0.73% | 1.5% |
Similar Demographics by Doctorate Degree
Demographics Similar to Marshallese by Doctorate Degree
In terms of doctorate degree, the demographic groups most similar to Marshallese are Ecuadorian (1.5%, a difference of 0.010%), Tohono O'odham (1.5%, a difference of 0.080%), British West Indian (1.5%, a difference of 0.13%), Central American (1.5%, a difference of 0.18%), and Hawaiian (1.5%, a difference of 0.22%).
| Demographics | Rating | Rank | Doctorate Degree |
| Immigrants | Barbados | 0.4 /100 | #272 | Tragic 1.5% |
| Sioux | 0.4 /100 | #273 | Tragic 1.5% |
| Yaqui | 0.4 /100 | #274 | Tragic 1.5% |
| Aleuts | 0.4 /100 | #275 | Tragic 1.5% |
| Paiute | 0.4 /100 | #276 | Tragic 1.5% |
| Bahamians | 0.4 /100 | #277 | Tragic 1.5% |
| Hawaiians | 0.4 /100 | #278 | Tragic 1.5% |
| Marshallese | 0.4 /100 | #279 | Tragic 1.5% |
| Ecuadorians | 0.4 /100 | #280 | Tragic 1.5% |
| Tohono O'odham | 0.4 /100 | #281 | Tragic 1.5% |
| British West Indians | 0.3 /100 | #282 | Tragic 1.5% |
| Central Americans | 0.3 /100 | #283 | Tragic 1.5% |
| Jamaicans | 0.3 /100 | #284 | Tragic 1.5% |
| Malaysians | 0.3 /100 | #285 | Tragic 1.5% |
| Cherokee | 0.3 /100 | #286 | Tragic 1.5% |
Demographics Similar to Immigrants from Oceania by Doctorate Degree
In terms of doctorate degree, the demographic groups most similar to Immigrants from Oceania are Immigrants from Kenya (1.9%, a difference of 0.050%), Albanian (1.9%, a difference of 0.15%), Immigrants from Albania (1.9%, a difference of 0.22%), Polish (1.9%, a difference of 0.24%), and Slavic (1.9%, a difference of 0.30%).
| Demographics | Rating | Rank | Doctorate Degree |
| Immigrants | Syria | 83.6 /100 | #146 | Excellent 1.9% |
| Immigrants | Senegal | 82.5 /100 | #147 | Excellent 1.9% |
| Luxembourgers | 81.1 /100 | #148 | Excellent 1.9% |
| Basques | 76.9 /100 | #149 | Good 1.9% |
| English | 75.9 /100 | #150 | Good 1.9% |
| Albanians | 74.8 /100 | #151 | Good 1.9% |
| Immigrants | Kenya | 74.3 /100 | #152 | Good 1.9% |
| Immigrants | Oceania | 74.0 /100 | #153 | Good 1.9% |
| Immigrants | Albania | 72.8 /100 | #154 | Good 1.9% |
| Poles | 72.7 /100 | #155 | Good 1.9% |
| Slavs | 72.4 /100 | #156 | Good 1.9% |
| Danes | 71.9 /100 | #157 | Good 1.9% |
| Hungarians | 71.7 /100 | #158 | Good 1.9% |
| Slovenes | 70.2 /100 | #159 | Good 1.9% |
| Welsh | 69.7 /100 | #160 | Good 1.9% |