Marshallese vs Immigrants from Scotland Doctorate Degree
COMPARE
Marshallese
Immigrants from Scotland
Doctorate Degree
Doctorate Degree Comparison
Marshallese
Immigrants from Scotland
1.5%
DOCTORATE DEGREE
0.4/ 100
METRIC RATING
279th/ 347
METRIC RANK
2.2%
DOCTORATE DEGREE
99.2/ 100
METRIC RATING
90th/ 347
METRIC RANK
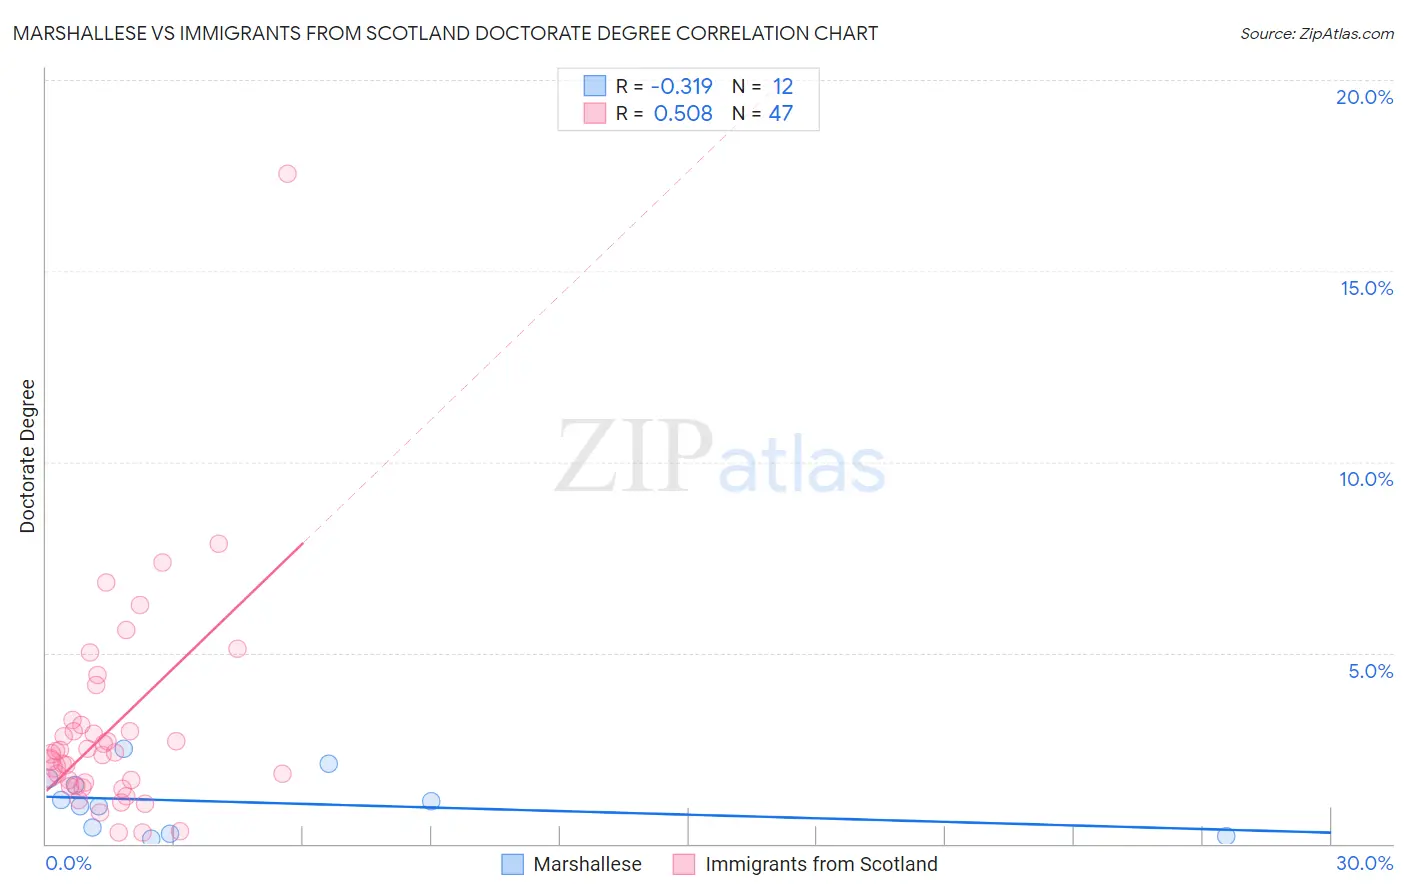
Marshallese vs Immigrants from Scotland Doctorate Degree Correlation Chart
The statistical analysis conducted on geographies consisting of 14,742,598 people shows a mild negative correlation between the proportion of Marshallese and percentage of population with at least doctorate degree education in the United States with a correlation coefficient (R) of -0.319 and weighted average of 1.5%. Similarly, the statistical analysis conducted on geographies consisting of 195,756,585 people shows a substantial positive correlation between the proportion of Immigrants from Scotland and percentage of population with at least doctorate degree education in the United States with a correlation coefficient (R) of 0.508 and weighted average of 2.2%, a difference of 48.6%.
Doctorate Degree Correlation Summary
| Measurement | Marshallese | Immigrants from Scotland |
| Minimum | 0.14% | 0.29% |
| Maximum | 2.5% | 17.6% |
| Range | 2.3% | 17.3% |
| Mean | 1.1% | 3.0% |
| Median | 1.1% | 2.3% |
| Interquartile 25% (IQ1) | 0.35% | 1.5% |
| Interquartile 75% (IQ3) | 1.6% | 3.1% |
| Interquartile Range (IQR) | 1.3% | 1.6% |
| Standard Deviation (Sample) | 0.76% | 2.8% |
| Standard Deviation (Population) | 0.73% | 2.8% |
Similar Demographics by Doctorate Degree
Demographics Similar to Marshallese by Doctorate Degree
In terms of doctorate degree, the demographic groups most similar to Marshallese are Ecuadorian (1.5%, a difference of 0.010%), Tohono O'odham (1.5%, a difference of 0.080%), British West Indian (1.5%, a difference of 0.13%), Central American (1.5%, a difference of 0.18%), and Hawaiian (1.5%, a difference of 0.22%).
| Demographics | Rating | Rank | Doctorate Degree |
| Immigrants | Barbados | 0.4 /100 | #272 | Tragic 1.5% |
| Sioux | 0.4 /100 | #273 | Tragic 1.5% |
| Yaqui | 0.4 /100 | #274 | Tragic 1.5% |
| Aleuts | 0.4 /100 | #275 | Tragic 1.5% |
| Paiute | 0.4 /100 | #276 | Tragic 1.5% |
| Bahamians | 0.4 /100 | #277 | Tragic 1.5% |
| Hawaiians | 0.4 /100 | #278 | Tragic 1.5% |
| Marshallese | 0.4 /100 | #279 | Tragic 1.5% |
| Ecuadorians | 0.4 /100 | #280 | Tragic 1.5% |
| Tohono O'odham | 0.4 /100 | #281 | Tragic 1.5% |
| British West Indians | 0.3 /100 | #282 | Tragic 1.5% |
| Central Americans | 0.3 /100 | #283 | Tragic 1.5% |
| Jamaicans | 0.3 /100 | #284 | Tragic 1.5% |
| Malaysians | 0.3 /100 | #285 | Tragic 1.5% |
| Cherokee | 0.3 /100 | #286 | Tragic 1.5% |
Demographics Similar to Immigrants from Scotland by Doctorate Degree
In terms of doctorate degree, the demographic groups most similar to Immigrants from Scotland are British (2.2%, a difference of 0.020%), Immigrants from Nepal (2.2%, a difference of 0.45%), Immigrants from Sudan (2.2%, a difference of 0.47%), Chilean (2.2%, a difference of 0.73%), and Immigrants from Zimbabwe (2.2%, a difference of 0.82%).
| Demographics | Rating | Rank | Doctorate Degree |
| Immigrants | Lithuania | 99.6 /100 | #83 | Exceptional 2.2% |
| Immigrants | England | 99.6 /100 | #84 | Exceptional 2.2% |
| Immigrants | Brazil | 99.6 /100 | #85 | Exceptional 2.2% |
| Egyptians | 99.4 /100 | #86 | Exceptional 2.2% |
| Immigrants | Zimbabwe | 99.4 /100 | #87 | Exceptional 2.2% |
| Immigrants | Nepal | 99.3 /100 | #88 | Exceptional 2.2% |
| British | 99.3 /100 | #89 | Exceptional 2.2% |
| Immigrants | Scotland | 99.2 /100 | #90 | Exceptional 2.2% |
| Immigrants | Sudan | 99.1 /100 | #91 | Exceptional 2.2% |
| Chileans | 99.1 /100 | #92 | Exceptional 2.2% |
| Alsatians | 99.0 /100 | #93 | Exceptional 2.1% |
| Greeks | 98.8 /100 | #94 | Exceptional 2.1% |
| Immigrants | Romania | 98.7 /100 | #95 | Exceptional 2.1% |
| Immigrants | Northern Africa | 98.4 /100 | #96 | Exceptional 2.1% |
| Immigrants | Eritrea | 98.4 /100 | #97 | Exceptional 2.1% |