Marshallese vs Immigrants from Belize Doctorate Degree
COMPARE
Marshallese
Immigrants from Belize
Doctorate Degree
Doctorate Degree Comparison
Marshallese
Immigrants from Belize
1.5%
DOCTORATE DEGREE
0.4/ 100
METRIC RATING
279th/ 347
METRIC RANK
1.3%
DOCTORATE DEGREE
0.1/ 100
METRIC RATING
323rd/ 347
METRIC RANK
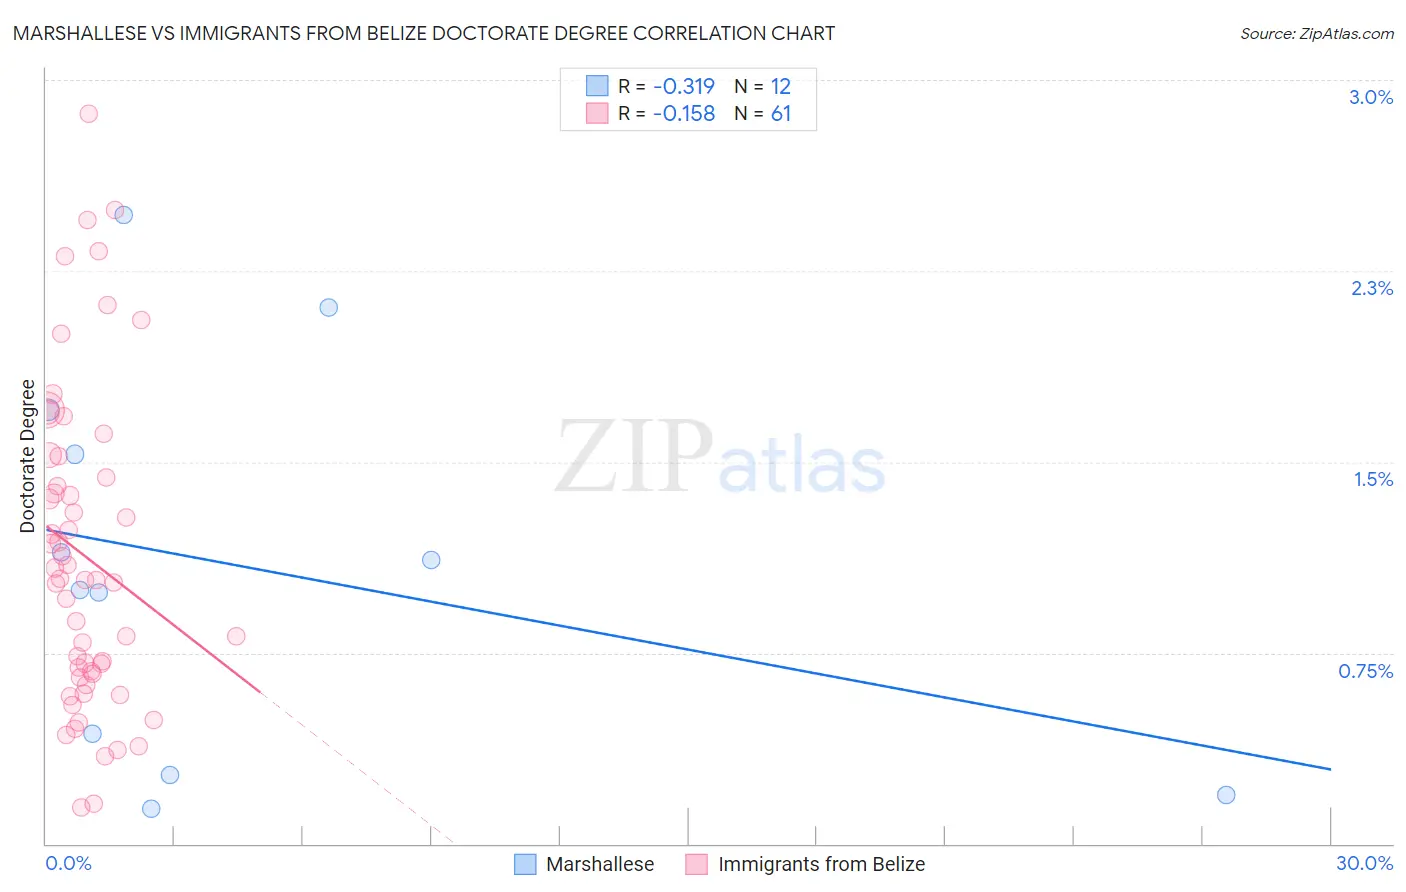
Marshallese vs Immigrants from Belize Doctorate Degree Correlation Chart
The statistical analysis conducted on geographies consisting of 14,742,598 people shows a mild negative correlation between the proportion of Marshallese and percentage of population with at least doctorate degree education in the United States with a correlation coefficient (R) of -0.319 and weighted average of 1.5%. Similarly, the statistical analysis conducted on geographies consisting of 129,933,258 people shows a poor negative correlation between the proportion of Immigrants from Belize and percentage of population with at least doctorate degree education in the United States with a correlation coefficient (R) of -0.158 and weighted average of 1.3%, a difference of 9.9%.
Doctorate Degree Correlation Summary
| Measurement | Marshallese | Immigrants from Belize |
| Minimum | 0.14% | 0.14% |
| Maximum | 2.5% | 2.9% |
| Range | 2.3% | 2.7% |
| Mean | 1.1% | 1.1% |
| Median | 1.1% | 1.0% |
| Interquartile 25% (IQ1) | 0.35% | 0.66% |
| Interquartile 75% (IQ3) | 1.6% | 1.5% |
| Interquartile Range (IQR) | 1.3% | 0.82% |
| Standard Deviation (Sample) | 0.76% | 0.62% |
| Standard Deviation (Population) | 0.73% | 0.62% |
Similar Demographics by Doctorate Degree
Demographics Similar to Marshallese by Doctorate Degree
In terms of doctorate degree, the demographic groups most similar to Marshallese are Ecuadorian (1.5%, a difference of 0.010%), Tohono O'odham (1.5%, a difference of 0.080%), British West Indian (1.5%, a difference of 0.13%), Central American (1.5%, a difference of 0.18%), and Hawaiian (1.5%, a difference of 0.22%).
| Demographics | Rating | Rank | Doctorate Degree |
| Immigrants | Barbados | 0.4 /100 | #272 | Tragic 1.5% |
| Sioux | 0.4 /100 | #273 | Tragic 1.5% |
| Yaqui | 0.4 /100 | #274 | Tragic 1.5% |
| Aleuts | 0.4 /100 | #275 | Tragic 1.5% |
| Paiute | 0.4 /100 | #276 | Tragic 1.5% |
| Bahamians | 0.4 /100 | #277 | Tragic 1.5% |
| Hawaiians | 0.4 /100 | #278 | Tragic 1.5% |
| Marshallese | 0.4 /100 | #279 | Tragic 1.5% |
| Ecuadorians | 0.4 /100 | #280 | Tragic 1.5% |
| Tohono O'odham | 0.4 /100 | #281 | Tragic 1.5% |
| British West Indians | 0.3 /100 | #282 | Tragic 1.5% |
| Central Americans | 0.3 /100 | #283 | Tragic 1.5% |
| Jamaicans | 0.3 /100 | #284 | Tragic 1.5% |
| Malaysians | 0.3 /100 | #285 | Tragic 1.5% |
| Cherokee | 0.3 /100 | #286 | Tragic 1.5% |
Demographics Similar to Immigrants from Belize by Doctorate Degree
In terms of doctorate degree, the demographic groups most similar to Immigrants from Belize are Seminole (1.3%, a difference of 0.20%), Dutch West Indian (1.3%, a difference of 0.26%), Native/Alaskan (1.3%, a difference of 0.32%), Immigrants from St. Vincent and the Grenadines (1.3%, a difference of 0.36%), and Immigrants from Guyana (1.3%, a difference of 0.43%).
| Demographics | Rating | Rank | Doctorate Degree |
| Navajo | 0.1 /100 | #316 | Tragic 1.4% |
| Immigrants | Micronesia | 0.1 /100 | #317 | Tragic 1.3% |
| Creek | 0.1 /100 | #318 | Tragic 1.3% |
| Immigrants | Guyana | 0.1 /100 | #319 | Tragic 1.3% |
| Immigrants | St. Vincent and the Grenadines | 0.1 /100 | #320 | Tragic 1.3% |
| Dutch West Indians | 0.1 /100 | #321 | Tragic 1.3% |
| Seminole | 0.1 /100 | #322 | Tragic 1.3% |
| Immigrants | Belize | 0.1 /100 | #323 | Tragic 1.3% |
| Natives/Alaskans | 0.0 /100 | #324 | Tragic 1.3% |
| Pima | 0.0 /100 | #325 | Tragic 1.3% |
| Immigrants | Cabo Verde | 0.0 /100 | #326 | Tragic 1.3% |
| Hispanics or Latinos | 0.0 /100 | #327 | Tragic 1.3% |
| Inupiat | 0.0 /100 | #328 | Tragic 1.3% |
| Haitians | 0.0 /100 | #329 | Tragic 1.3% |
| Yup'ik | 0.0 /100 | #330 | Tragic 1.3% |