Marshallese vs Tsimshian Associate's Degree
COMPARE
Marshallese
Tsimshian
Associate's Degree
Associate's Degree Comparison
Marshallese
Tsimshian
41.6%
ASSOCIATE'S DEGREE
0.4/ 100
METRIC RATING
260th/ 347
METRIC RANK
38.6%
ASSOCIATE'S DEGREE
0.0/ 100
METRIC RATING
301st/ 347
METRIC RANK
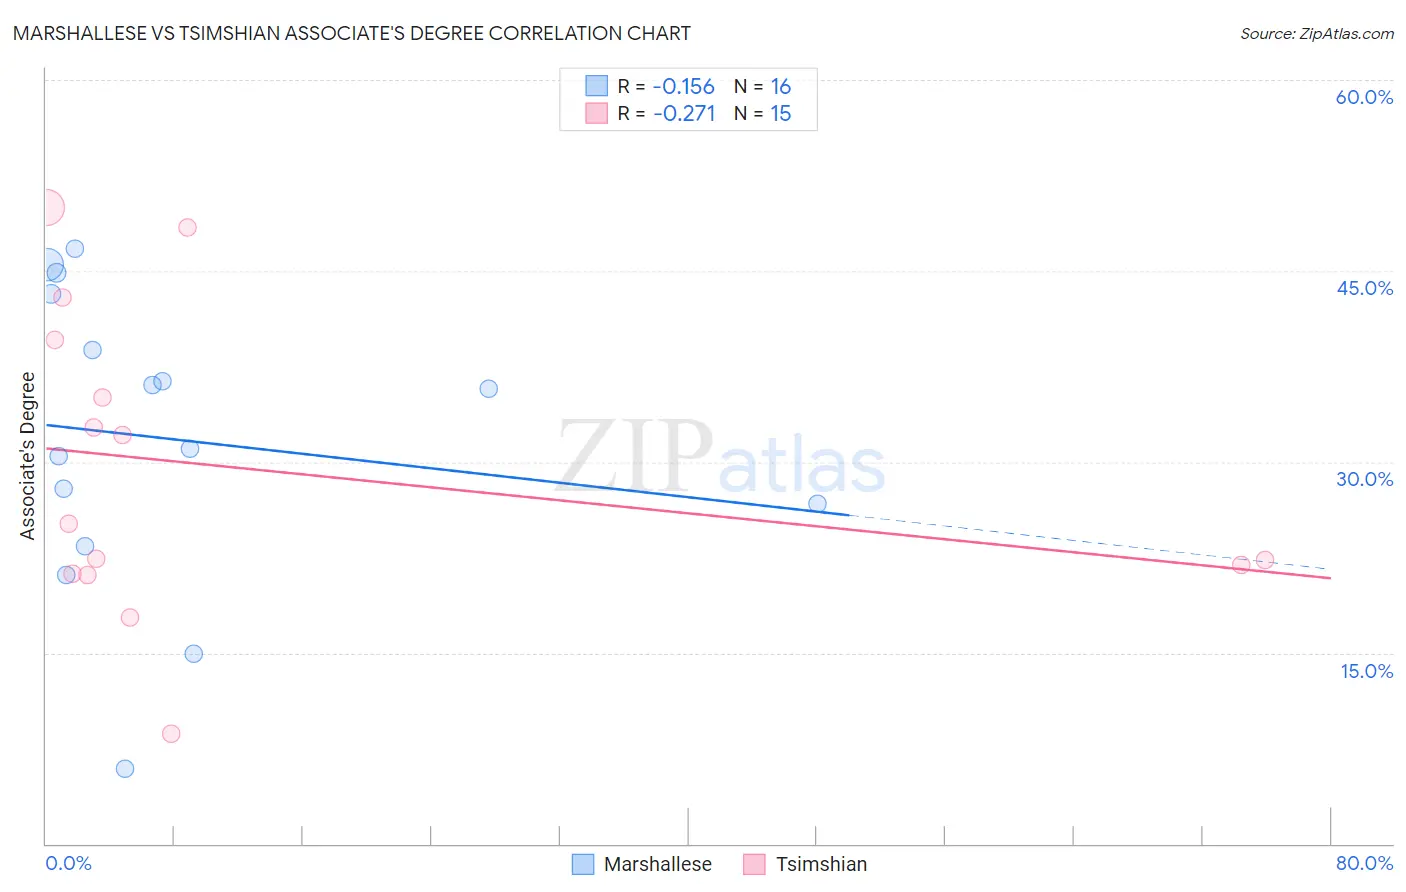
Marshallese vs Tsimshian Associate's Degree Correlation Chart
The statistical analysis conducted on geographies consisting of 14,761,315 people shows a poor negative correlation between the proportion of Marshallese and percentage of population with at least associate's degree education in the United States with a correlation coefficient (R) of -0.156 and weighted average of 41.6%. Similarly, the statistical analysis conducted on geographies consisting of 15,626,544 people shows a weak negative correlation between the proportion of Tsimshian and percentage of population with at least associate's degree education in the United States with a correlation coefficient (R) of -0.271 and weighted average of 38.6%, a difference of 7.7%.
Associate's Degree Correlation Summary
| Measurement | Marshallese | Tsimshian |
| Minimum | 5.9% | 8.6% |
| Maximum | 46.8% | 50.0% |
| Range | 40.9% | 41.4% |
| Mean | 31.8% | 29.4% |
| Median | 33.4% | 25.2% |
| Interquartile 25% (IQ1) | 25.1% | 21.2% |
| Interquartile 75% (IQ3) | 41.0% | 39.6% |
| Interquartile Range (IQR) | 15.9% | 18.4% |
| Standard Deviation (Sample) | 11.5% | 12.0% |
| Standard Deviation (Population) | 11.2% | 11.5% |
Similar Demographics by Associate's Degree
Demographics Similar to Marshallese by Associate's Degree
In terms of associate's degree, the demographic groups most similar to Marshallese are Nicaraguan (41.5%, a difference of 0.13%), Malaysian (41.6%, a difference of 0.19%), Bahamian (41.5%, a difference of 0.22%), Immigrants from Jamaica (41.5%, a difference of 0.24%), and Osage (41.5%, a difference of 0.25%).
| Demographics | Rating | Rank | Associate's Degree |
| Indonesians | 0.6 /100 | #253 | Tragic 41.9% |
| Cubans | 0.6 /100 | #254 | Tragic 41.9% |
| Immigrants | Guyana | 0.5 /100 | #255 | Tragic 41.8% |
| Immigrants | Congo | 0.5 /100 | #256 | Tragic 41.8% |
| Spanish Americans | 0.5 /100 | #257 | Tragic 41.8% |
| Japanese | 0.5 /100 | #258 | Tragic 41.7% |
| Malaysians | 0.4 /100 | #259 | Tragic 41.6% |
| Marshallese | 0.4 /100 | #260 | Tragic 41.6% |
| Nicaraguans | 0.4 /100 | #261 | Tragic 41.5% |
| Bahamians | 0.4 /100 | #262 | Tragic 41.5% |
| Immigrants | Jamaica | 0.3 /100 | #263 | Tragic 41.5% |
| Osage | 0.3 /100 | #264 | Tragic 41.5% |
| Africans | 0.2 /100 | #265 | Tragic 41.1% |
| Samoans | 0.2 /100 | #266 | Tragic 41.1% |
| Hawaiians | 0.2 /100 | #267 | Tragic 40.9% |
Demographics Similar to Tsimshian by Associate's Degree
In terms of associate's degree, the demographic groups most similar to Tsimshian are Chickasaw (38.6%, a difference of 0.060%), Ute (38.6%, a difference of 0.090%), Colville (38.5%, a difference of 0.15%), Cheyenne (38.7%, a difference of 0.19%), and Guatemalan (38.5%, a difference of 0.24%).
| Demographics | Rating | Rank | Associate's Degree |
| Salvadorans | 0.0 /100 | #294 | Tragic 39.0% |
| Hondurans | 0.0 /100 | #295 | Tragic 38.9% |
| Cherokee | 0.0 /100 | #296 | Tragic 38.9% |
| Cape Verdeans | 0.0 /100 | #297 | Tragic 38.8% |
| Cheyenne | 0.0 /100 | #298 | Tragic 38.7% |
| Ute | 0.0 /100 | #299 | Tragic 38.6% |
| Chickasaw | 0.0 /100 | #300 | Tragic 38.6% |
| Tsimshian | 0.0 /100 | #301 | Tragic 38.6% |
| Colville | 0.0 /100 | #302 | Tragic 38.5% |
| Guatemalans | 0.0 /100 | #303 | Tragic 38.5% |
| Sioux | 0.0 /100 | #304 | Tragic 38.5% |
| Immigrants | Honduras | 0.0 /100 | #305 | Tragic 38.5% |
| Shoshone | 0.0 /100 | #306 | Tragic 38.4% |
| Immigrants | El Salvador | 0.0 /100 | #307 | Tragic 38.4% |
| Mexican American Indians | 0.0 /100 | #308 | Tragic 38.2% |