Armenian vs Tsimshian Associate's Degree
COMPARE
Armenian
Tsimshian
Associate's Degree
Associate's Degree Comparison
Armenians
Tsimshian
50.4%
ASSOCIATE'S DEGREE
99.1/ 100
METRIC RATING
80th/ 347
METRIC RANK
38.6%
ASSOCIATE'S DEGREE
0.0/ 100
METRIC RATING
301st/ 347
METRIC RANK
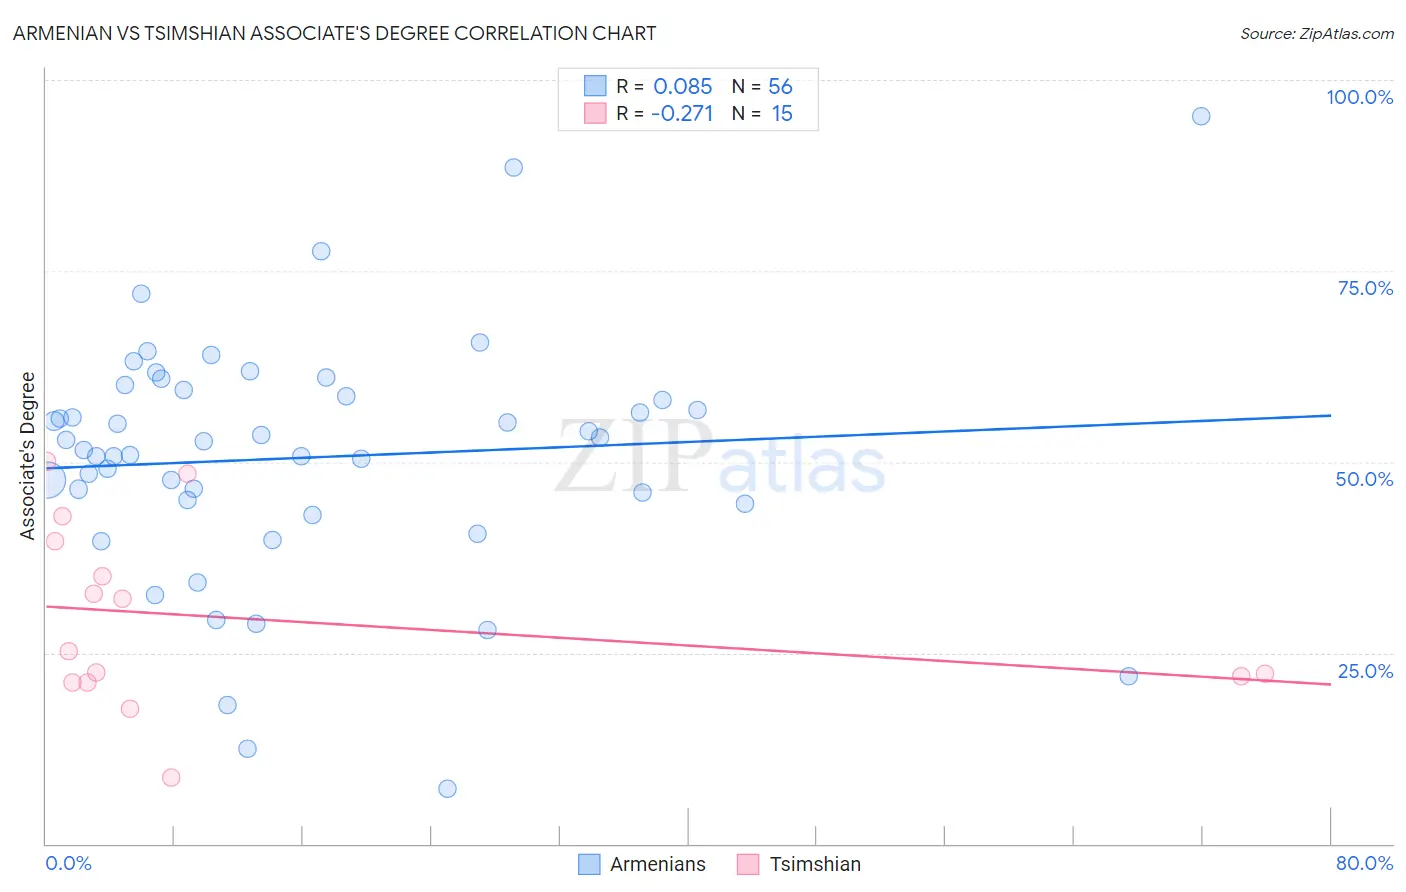
Armenian vs Tsimshian Associate's Degree Correlation Chart
The statistical analysis conducted on geographies consisting of 310,941,710 people shows a slight positive correlation between the proportion of Armenians and percentage of population with at least associate's degree education in the United States with a correlation coefficient (R) of 0.085 and weighted average of 50.4%. Similarly, the statistical analysis conducted on geographies consisting of 15,626,544 people shows a weak negative correlation between the proportion of Tsimshian and percentage of population with at least associate's degree education in the United States with a correlation coefficient (R) of -0.271 and weighted average of 38.6%, a difference of 30.7%.
Associate's Degree Correlation Summary
| Measurement | Armenian | Tsimshian |
| Minimum | 7.2% | 8.6% |
| Maximum | 95.3% | 50.0% |
| Range | 88.1% | 41.4% |
| Mean | 50.6% | 29.4% |
| Median | 52.1% | 25.2% |
| Interquartile 25% (IQ1) | 44.7% | 21.2% |
| Interquartile 75% (IQ3) | 59.0% | 39.6% |
| Interquartile Range (IQR) | 14.3% | 18.4% |
| Standard Deviation (Sample) | 16.0% | 12.0% |
| Standard Deviation (Population) | 15.9% | 11.5% |
Similar Demographics by Associate's Degree
Demographics Similar to Armenians by Associate's Degree
In terms of associate's degree, the demographic groups most similar to Armenians are Ethiopian (50.4%, a difference of 0.030%), Immigrants from Eastern Europe (50.5%, a difference of 0.050%), Maltese (50.4%, a difference of 0.070%), Immigrants from Lebanon (50.5%, a difference of 0.090%), and Immigrants from Zimbabwe (50.5%, a difference of 0.12%).
| Demographics | Rating | Rank | Associate's Degree |
| Carpatho Rusyns | 99.3 /100 | #73 | Exceptional 50.6% |
| Lithuanians | 99.3 /100 | #74 | Exceptional 50.6% |
| Immigrants | Scotland | 99.3 /100 | #75 | Exceptional 50.6% |
| Immigrants | Zimbabwe | 99.2 /100 | #76 | Exceptional 50.5% |
| Immigrants | Lebanon | 99.1 /100 | #77 | Exceptional 50.5% |
| Immigrants | Eastern Europe | 99.1 /100 | #78 | Exceptional 50.5% |
| Ethiopians | 99.1 /100 | #79 | Exceptional 50.4% |
| Armenians | 99.1 /100 | #80 | Exceptional 50.4% |
| Maltese | 99.1 /100 | #81 | Exceptional 50.4% |
| Greeks | 98.9 /100 | #82 | Exceptional 50.3% |
| Immigrants | Uzbekistan | 98.9 /100 | #83 | Exceptional 50.3% |
| Immigrants | Hungary | 98.9 /100 | #84 | Exceptional 50.2% |
| Immigrants | Egypt | 98.9 /100 | #85 | Exceptional 50.2% |
| Immigrants | Croatia | 98.9 /100 | #86 | Exceptional 50.2% |
| Immigrants | Moldova | 98.8 /100 | #87 | Exceptional 50.2% |
Demographics Similar to Tsimshian by Associate's Degree
In terms of associate's degree, the demographic groups most similar to Tsimshian are Chickasaw (38.6%, a difference of 0.060%), Ute (38.6%, a difference of 0.090%), Colville (38.5%, a difference of 0.15%), Cheyenne (38.7%, a difference of 0.19%), and Guatemalan (38.5%, a difference of 0.24%).
| Demographics | Rating | Rank | Associate's Degree |
| Salvadorans | 0.0 /100 | #294 | Tragic 39.0% |
| Hondurans | 0.0 /100 | #295 | Tragic 38.9% |
| Cherokee | 0.0 /100 | #296 | Tragic 38.9% |
| Cape Verdeans | 0.0 /100 | #297 | Tragic 38.8% |
| Cheyenne | 0.0 /100 | #298 | Tragic 38.7% |
| Ute | 0.0 /100 | #299 | Tragic 38.6% |
| Chickasaw | 0.0 /100 | #300 | Tragic 38.6% |
| Tsimshian | 0.0 /100 | #301 | Tragic 38.6% |
| Colville | 0.0 /100 | #302 | Tragic 38.5% |
| Guatemalans | 0.0 /100 | #303 | Tragic 38.5% |
| Sioux | 0.0 /100 | #304 | Tragic 38.5% |
| Immigrants | Honduras | 0.0 /100 | #305 | Tragic 38.5% |
| Shoshone | 0.0 /100 | #306 | Tragic 38.4% |
| Immigrants | El Salvador | 0.0 /100 | #307 | Tragic 38.4% |
| Mexican American Indians | 0.0 /100 | #308 | Tragic 38.2% |