Canadian vs Tsimshian Associate's Degree
COMPARE
Canadian
Tsimshian
Associate's Degree
Associate's Degree Comparison
Canadians
Tsimshian
47.5%
ASSOCIATE'S DEGREE
79.0/ 100
METRIC RATING
145th/ 347
METRIC RANK
38.6%
ASSOCIATE'S DEGREE
0.0/ 100
METRIC RATING
301st/ 347
METRIC RANK
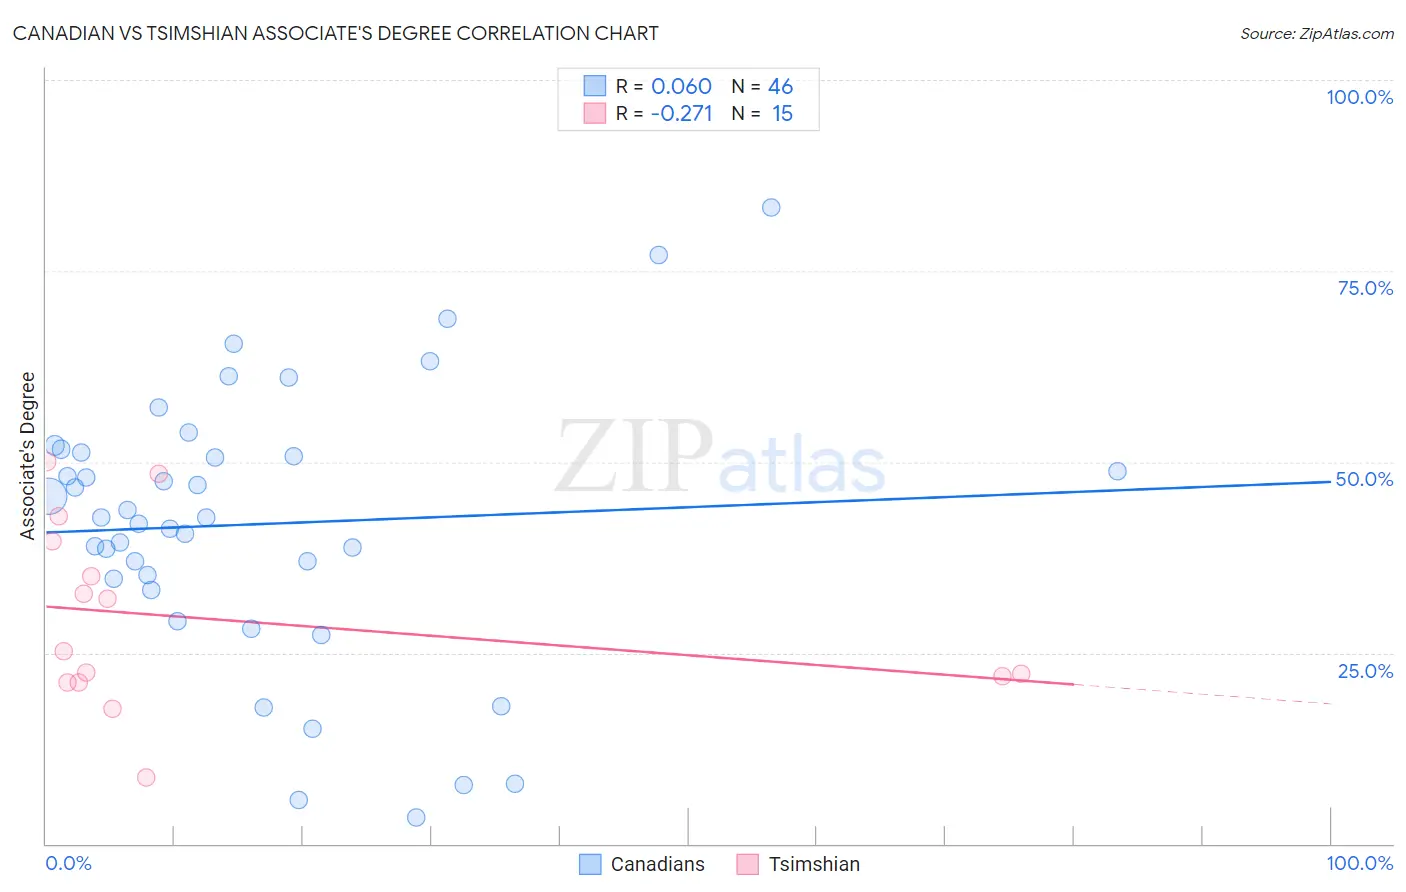
Canadian vs Tsimshian Associate's Degree Correlation Chart
The statistical analysis conducted on geographies consisting of 437,535,848 people shows a slight positive correlation between the proportion of Canadians and percentage of population with at least associate's degree education in the United States with a correlation coefficient (R) of 0.060 and weighted average of 47.5%. Similarly, the statistical analysis conducted on geographies consisting of 15,626,544 people shows a weak negative correlation between the proportion of Tsimshian and percentage of population with at least associate's degree education in the United States with a correlation coefficient (R) of -0.271 and weighted average of 38.6%, a difference of 23.1%.
Associate's Degree Correlation Summary
| Measurement | Canadian | Tsimshian |
| Minimum | 3.4% | 8.6% |
| Maximum | 83.3% | 50.0% |
| Range | 80.0% | 41.4% |
| Mean | 41.8% | 29.4% |
| Median | 42.7% | 25.2% |
| Interquartile 25% (IQ1) | 34.7% | 21.2% |
| Interquartile 75% (IQ3) | 51.3% | 39.6% |
| Interquartile Range (IQR) | 16.6% | 18.4% |
| Standard Deviation (Sample) | 17.8% | 12.0% |
| Standard Deviation (Population) | 17.6% | 11.5% |
Similar Demographics by Associate's Degree
Demographics Similar to Canadians by Associate's Degree
In terms of associate's degree, the demographic groups most similar to Canadians are Immigrants from Sudan (47.4%, a difference of 0.13%), Slavic (47.6%, a difference of 0.17%), Danish (47.4%, a difference of 0.18%), Norwegian (47.6%, a difference of 0.23%), and South American Indian (47.4%, a difference of 0.24%).
| Demographics | Rating | Rank | Associate's Degree |
| Poles | 87.3 /100 | #138 | Excellent 48.0% |
| Slovenes | 85.1 /100 | #139 | Excellent 47.9% |
| Immigrants | Southern Europe | 84.4 /100 | #140 | Excellent 47.8% |
| Taiwanese | 83.3 /100 | #141 | Excellent 47.7% |
| Sierra Leoneans | 82.9 /100 | #142 | Excellent 47.7% |
| Norwegians | 81.0 /100 | #143 | Excellent 47.6% |
| Slavs | 80.5 /100 | #144 | Excellent 47.6% |
| Canadians | 79.0 /100 | #145 | Good 47.5% |
| Immigrants | Sudan | 77.9 /100 | #146 | Good 47.4% |
| Danes | 77.3 /100 | #147 | Good 47.4% |
| South American Indians | 76.7 /100 | #148 | Good 47.4% |
| Immigrants | Armenia | 76.6 /100 | #149 | Good 47.4% |
| Iraqis | 76.2 /100 | #150 | Good 47.4% |
| Immigrants | North Macedonia | 76.0 /100 | #151 | Good 47.4% |
| Immigrants | Afghanistan | 74.3 /100 | #152 | Good 47.3% |
Demographics Similar to Tsimshian by Associate's Degree
In terms of associate's degree, the demographic groups most similar to Tsimshian are Chickasaw (38.6%, a difference of 0.060%), Ute (38.6%, a difference of 0.090%), Colville (38.5%, a difference of 0.15%), Cheyenne (38.7%, a difference of 0.19%), and Guatemalan (38.5%, a difference of 0.24%).
| Demographics | Rating | Rank | Associate's Degree |
| Salvadorans | 0.0 /100 | #294 | Tragic 39.0% |
| Hondurans | 0.0 /100 | #295 | Tragic 38.9% |
| Cherokee | 0.0 /100 | #296 | Tragic 38.9% |
| Cape Verdeans | 0.0 /100 | #297 | Tragic 38.8% |
| Cheyenne | 0.0 /100 | #298 | Tragic 38.7% |
| Ute | 0.0 /100 | #299 | Tragic 38.6% |
| Chickasaw | 0.0 /100 | #300 | Tragic 38.6% |
| Tsimshian | 0.0 /100 | #301 | Tragic 38.6% |
| Colville | 0.0 /100 | #302 | Tragic 38.5% |
| Guatemalans | 0.0 /100 | #303 | Tragic 38.5% |
| Sioux | 0.0 /100 | #304 | Tragic 38.5% |
| Immigrants | Honduras | 0.0 /100 | #305 | Tragic 38.5% |
| Shoshone | 0.0 /100 | #306 | Tragic 38.4% |
| Immigrants | El Salvador | 0.0 /100 | #307 | Tragic 38.4% |
| Mexican American Indians | 0.0 /100 | #308 | Tragic 38.2% |