Chinese vs Tsimshian Associate's Degree
COMPARE
Chinese
Tsimshian
Associate's Degree
Associate's Degree Comparison
Chinese
Tsimshian
48.5%
ASSOCIATE'S DEGREE
92.5/ 100
METRIC RATING
125th/ 347
METRIC RANK
38.6%
ASSOCIATE'S DEGREE
0.0/ 100
METRIC RATING
301st/ 347
METRIC RANK
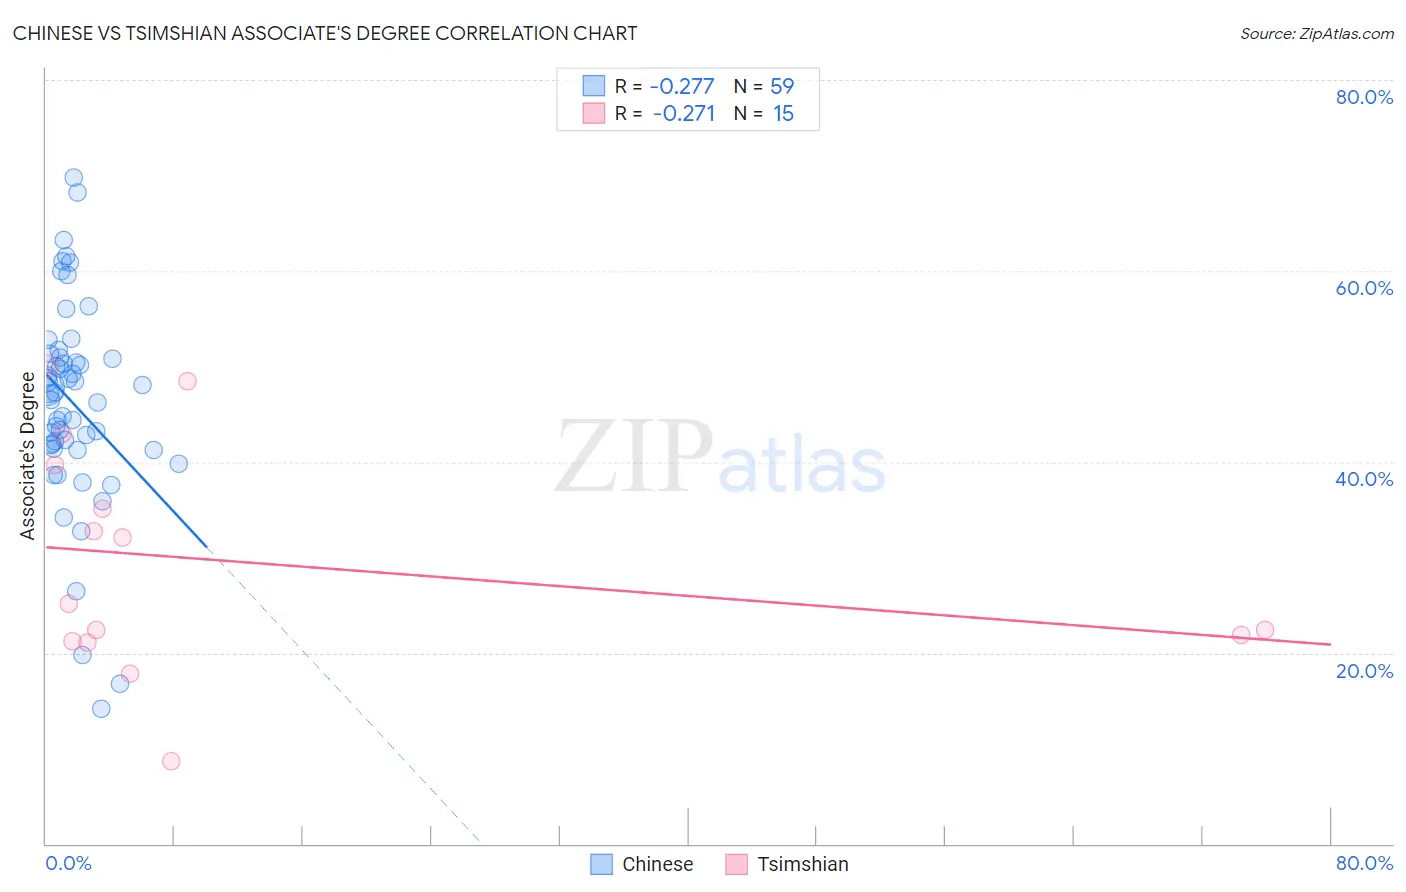
Chinese vs Tsimshian Associate's Degree Correlation Chart
The statistical analysis conducted on geographies consisting of 64,809,883 people shows a weak negative correlation between the proportion of Chinese and percentage of population with at least associate's degree education in the United States with a correlation coefficient (R) of -0.277 and weighted average of 48.5%. Similarly, the statistical analysis conducted on geographies consisting of 15,626,544 people shows a weak negative correlation between the proportion of Tsimshian and percentage of population with at least associate's degree education in the United States with a correlation coefficient (R) of -0.271 and weighted average of 38.6%, a difference of 25.8%.
Associate's Degree Correlation Summary
| Measurement | Chinese | Tsimshian |
| Minimum | 14.2% | 8.6% |
| Maximum | 69.8% | 50.0% |
| Range | 55.6% | 41.4% |
| Mean | 46.1% | 29.4% |
| Median | 47.1% | 25.2% |
| Interquartile 25% (IQ1) | 41.4% | 21.2% |
| Interquartile 75% (IQ3) | 50.9% | 39.6% |
| Interquartile Range (IQR) | 9.5% | 18.4% |
| Standard Deviation (Sample) | 10.8% | 12.0% |
| Standard Deviation (Population) | 10.7% | 11.5% |
Similar Demographics by Associate's Degree
Demographics Similar to Chinese by Associate's Degree
In terms of associate's degree, the demographic groups most similar to Chinese are Serbian (48.5%, a difference of 0.020%), Immigrants from Syria (48.5%, a difference of 0.090%), Immigrants from Uganda (48.5%, a difference of 0.10%), Immigrants from Eastern Africa (48.4%, a difference of 0.22%), and Swedish (48.4%, a difference of 0.25%).
| Demographics | Rating | Rank | Associate's Degree |
| Albanians | 94.7 /100 | #118 | Exceptional 48.8% |
| Lebanese | 94.6 /100 | #119 | Exceptional 48.8% |
| Alsatians | 94.6 /100 | #120 | Exceptional 48.8% |
| Ugandans | 93.9 /100 | #121 | Exceptional 48.7% |
| Italians | 93.9 /100 | #122 | Exceptional 48.7% |
| Brazilians | 93.7 /100 | #123 | Exceptional 48.7% |
| Serbians | 92.6 /100 | #124 | Exceptional 48.5% |
| Chinese | 92.5 /100 | #125 | Exceptional 48.5% |
| Immigrants | Syria | 92.2 /100 | #126 | Exceptional 48.5% |
| Immigrants | Uganda | 92.1 /100 | #127 | Exceptional 48.5% |
| Immigrants | Eastern Africa | 91.6 /100 | #128 | Exceptional 48.4% |
| Swedes | 91.5 /100 | #129 | Exceptional 48.4% |
| Immigrants | Jordan | 91.2 /100 | #130 | Exceptional 48.4% |
| Icelanders | 90.8 /100 | #131 | Exceptional 48.3% |
| Immigrants | Albania | 89.9 /100 | #132 | Excellent 48.2% |
Demographics Similar to Tsimshian by Associate's Degree
In terms of associate's degree, the demographic groups most similar to Tsimshian are Chickasaw (38.6%, a difference of 0.060%), Ute (38.6%, a difference of 0.090%), Colville (38.5%, a difference of 0.15%), Cheyenne (38.7%, a difference of 0.19%), and Guatemalan (38.5%, a difference of 0.24%).
| Demographics | Rating | Rank | Associate's Degree |
| Salvadorans | 0.0 /100 | #294 | Tragic 39.0% |
| Hondurans | 0.0 /100 | #295 | Tragic 38.9% |
| Cherokee | 0.0 /100 | #296 | Tragic 38.9% |
| Cape Verdeans | 0.0 /100 | #297 | Tragic 38.8% |
| Cheyenne | 0.0 /100 | #298 | Tragic 38.7% |
| Ute | 0.0 /100 | #299 | Tragic 38.6% |
| Chickasaw | 0.0 /100 | #300 | Tragic 38.6% |
| Tsimshian | 0.0 /100 | #301 | Tragic 38.6% |
| Colville | 0.0 /100 | #302 | Tragic 38.5% |
| Guatemalans | 0.0 /100 | #303 | Tragic 38.5% |
| Sioux | 0.0 /100 | #304 | Tragic 38.5% |
| Immigrants | Honduras | 0.0 /100 | #305 | Tragic 38.5% |
| Shoshone | 0.0 /100 | #306 | Tragic 38.4% |
| Immigrants | El Salvador | 0.0 /100 | #307 | Tragic 38.4% |
| Mexican American Indians | 0.0 /100 | #308 | Tragic 38.2% |