Marshallese vs Finnish Associate's Degree
COMPARE
Marshallese
Finnish
Associate's Degree
Associate's Degree Comparison
Marshallese
Finns
41.6%
ASSOCIATE'S DEGREE
0.4/ 100
METRIC RATING
260th/ 347
METRIC RANK
46.3%
ASSOCIATE'S DEGREE
48.5/ 100
METRIC RATING
176th/ 347
METRIC RANK
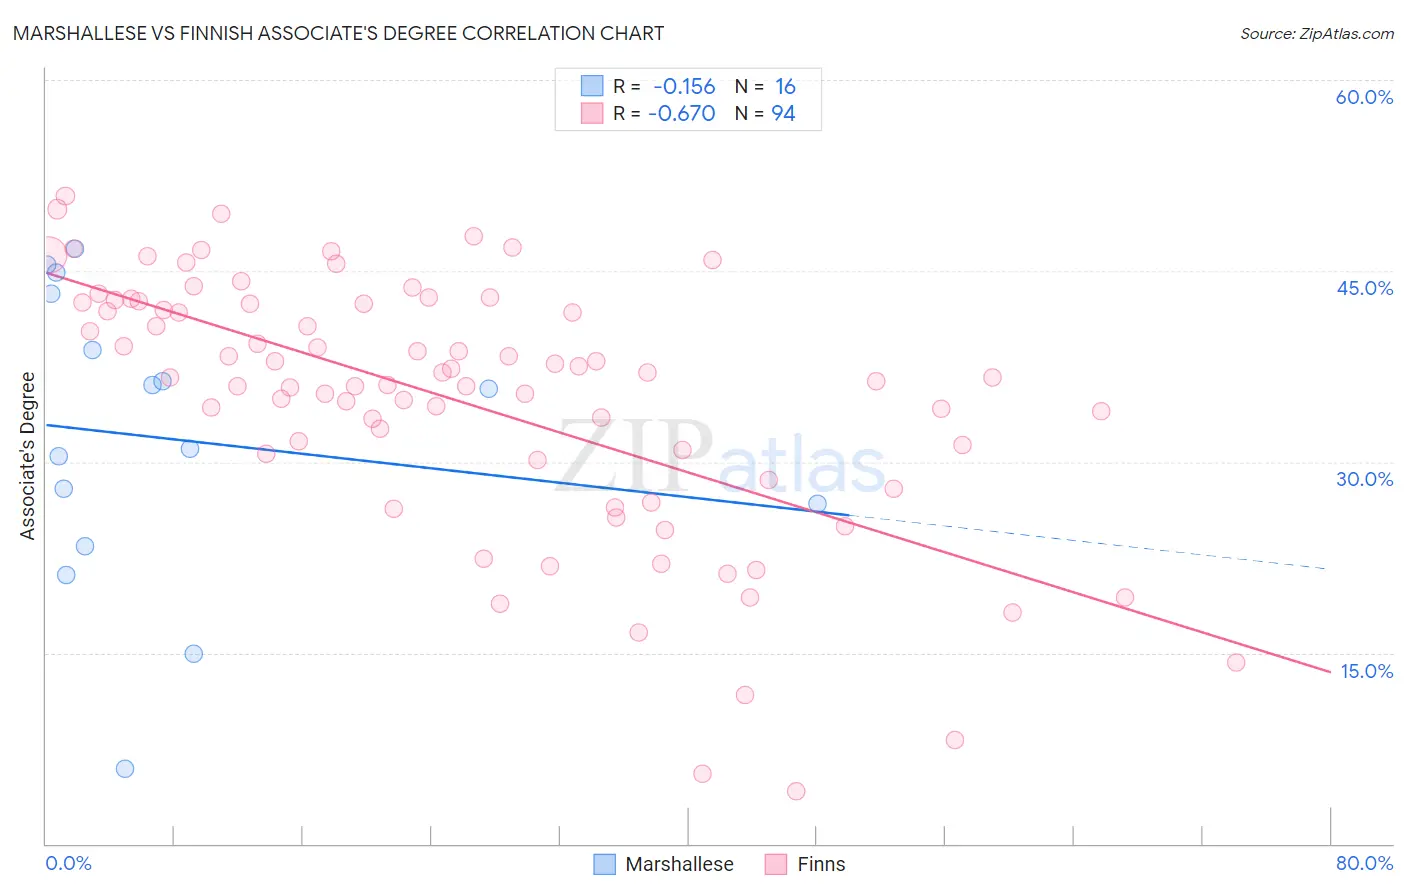
Marshallese vs Finnish Associate's Degree Correlation Chart
The statistical analysis conducted on geographies consisting of 14,761,315 people shows a poor negative correlation between the proportion of Marshallese and percentage of population with at least associate's degree education in the United States with a correlation coefficient (R) of -0.156 and weighted average of 41.6%. Similarly, the statistical analysis conducted on geographies consisting of 404,653,186 people shows a significant negative correlation between the proportion of Finns and percentage of population with at least associate's degree education in the United States with a correlation coefficient (R) of -0.670 and weighted average of 46.3%, a difference of 11.4%.
Associate's Degree Correlation Summary
| Measurement | Marshallese | Finnish |
| Minimum | 5.9% | 4.1% |
| Maximum | 46.8% | 50.9% |
| Range | 40.9% | 46.8% |
| Mean | 31.8% | 34.7% |
| Median | 33.4% | 36.6% |
| Interquartile 25% (IQ1) | 25.1% | 30.2% |
| Interquartile 75% (IQ3) | 41.0% | 42.4% |
| Interquartile Range (IQR) | 15.9% | 12.3% |
| Standard Deviation (Sample) | 11.5% | 10.2% |
| Standard Deviation (Population) | 11.2% | 10.1% |
Similar Demographics by Associate's Degree
Demographics Similar to Marshallese by Associate's Degree
In terms of associate's degree, the demographic groups most similar to Marshallese are Nicaraguan (41.5%, a difference of 0.13%), Malaysian (41.6%, a difference of 0.19%), Bahamian (41.5%, a difference of 0.22%), Immigrants from Jamaica (41.5%, a difference of 0.24%), and Osage (41.5%, a difference of 0.25%).
| Demographics | Rating | Rank | Associate's Degree |
| Indonesians | 0.6 /100 | #253 | Tragic 41.9% |
| Cubans | 0.6 /100 | #254 | Tragic 41.9% |
| Immigrants | Guyana | 0.5 /100 | #255 | Tragic 41.8% |
| Immigrants | Congo | 0.5 /100 | #256 | Tragic 41.8% |
| Spanish Americans | 0.5 /100 | #257 | Tragic 41.8% |
| Japanese | 0.5 /100 | #258 | Tragic 41.7% |
| Malaysians | 0.4 /100 | #259 | Tragic 41.6% |
| Marshallese | 0.4 /100 | #260 | Tragic 41.6% |
| Nicaraguans | 0.4 /100 | #261 | Tragic 41.5% |
| Bahamians | 0.4 /100 | #262 | Tragic 41.5% |
| Immigrants | Jamaica | 0.3 /100 | #263 | Tragic 41.5% |
| Osage | 0.3 /100 | #264 | Tragic 41.5% |
| Africans | 0.2 /100 | #265 | Tragic 41.1% |
| Samoans | 0.2 /100 | #266 | Tragic 41.1% |
| Hawaiians | 0.2 /100 | #267 | Tragic 40.9% |
Demographics Similar to Finns by Associate's Degree
In terms of associate's degree, the demographic groups most similar to Finns are Slovak (46.3%, a difference of 0.010%), Belgian (46.3%, a difference of 0.020%), Immigrants from Bosnia and Herzegovina (46.3%, a difference of 0.020%), Sri Lankan (46.3%, a difference of 0.070%), and English (46.4%, a difference of 0.11%).
| Demographics | Rating | Rank | Associate's Degree |
| Uruguayans | 55.4 /100 | #169 | Average 46.5% |
| Irish | 53.6 /100 | #170 | Average 46.5% |
| Basques | 52.8 /100 | #171 | Average 46.5% |
| Peruvians | 50.5 /100 | #172 | Average 46.4% |
| Immigrants | Iraq | 50.3 /100 | #173 | Average 46.4% |
| English | 50.0 /100 | #174 | Average 46.4% |
| Belgians | 48.9 /100 | #175 | Average 46.3% |
| Finns | 48.5 /100 | #176 | Average 46.3% |
| Slovaks | 48.4 /100 | #177 | Average 46.3% |
| Immigrants | Bosnia and Herzegovina | 48.3 /100 | #178 | Average 46.3% |
| Sri Lankans | 47.6 /100 | #179 | Average 46.3% |
| Bermudans | 46.4 /100 | #180 | Average 46.2% |
| Immigrants | Colombia | 41.3 /100 | #181 | Average 46.0% |
| Swiss | 40.4 /100 | #182 | Average 46.0% |
| Yugoslavians | 40.2 /100 | #183 | Average 46.0% |