Marshallese vs Scotch-Irish Associate's Degree
COMPARE
Marshallese
Scotch-Irish
Associate's Degree
Associate's Degree Comparison
Marshallese
Scotch-Irish
41.6%
ASSOCIATE'S DEGREE
0.4/ 100
METRIC RATING
260th/ 347
METRIC RANK
45.3%
ASSOCIATE'S DEGREE
22.3/ 100
METRIC RATING
197th/ 347
METRIC RANK
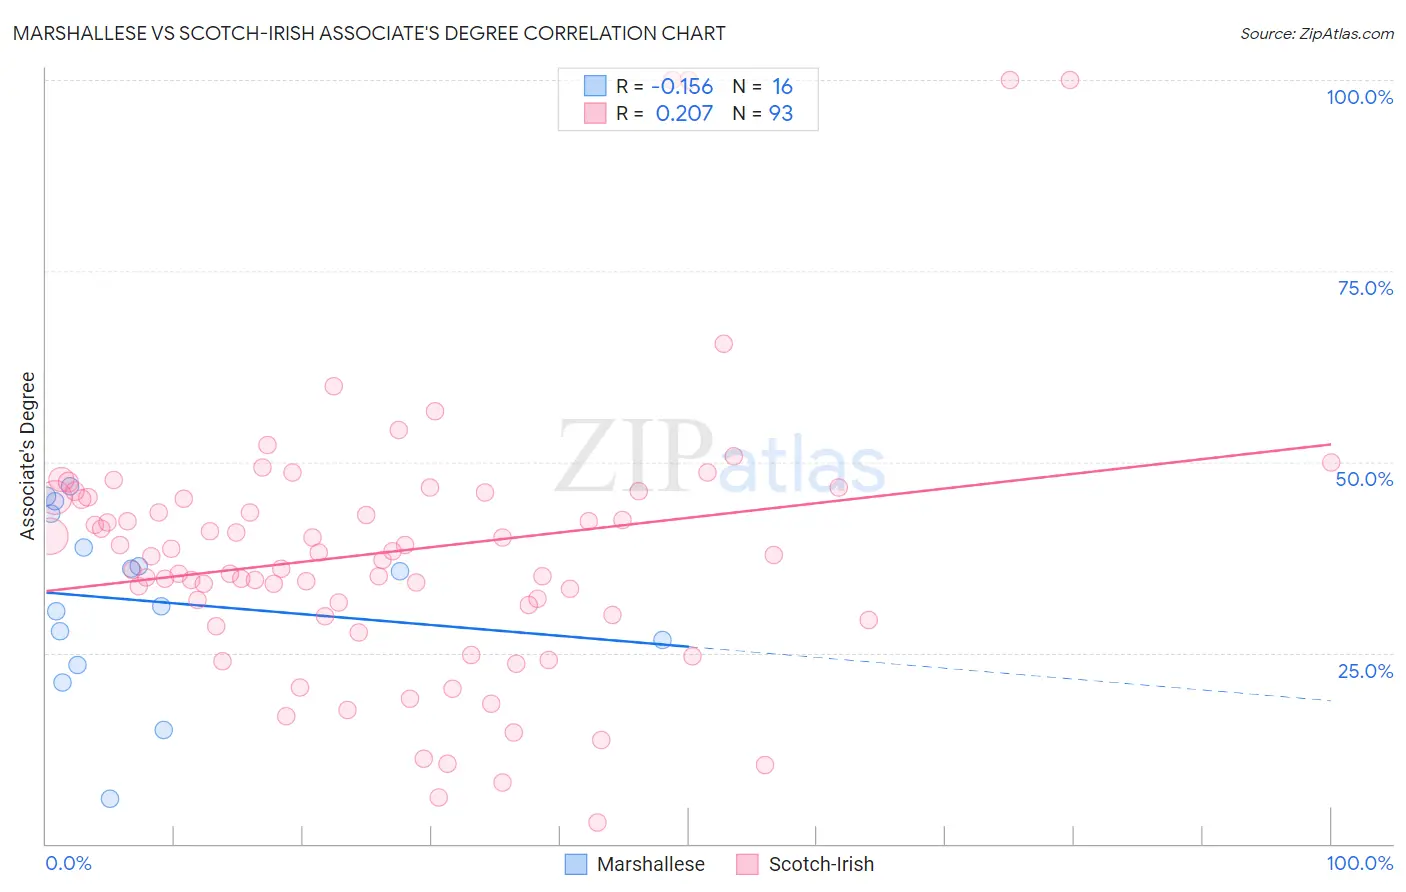
Marshallese vs Scotch-Irish Associate's Degree Correlation Chart
The statistical analysis conducted on geographies consisting of 14,761,315 people shows a poor negative correlation between the proportion of Marshallese and percentage of population with at least associate's degree education in the United States with a correlation coefficient (R) of -0.156 and weighted average of 41.6%. Similarly, the statistical analysis conducted on geographies consisting of 548,737,246 people shows a weak positive correlation between the proportion of Scotch-Irish and percentage of population with at least associate's degree education in the United States with a correlation coefficient (R) of 0.207 and weighted average of 45.3%, a difference of 8.9%.
Associate's Degree Correlation Summary
| Measurement | Marshallese | Scotch-Irish |
| Minimum | 5.9% | 2.9% |
| Maximum | 46.8% | 100.0% |
| Range | 40.9% | 97.1% |
| Mean | 31.8% | 38.2% |
| Median | 33.4% | 37.7% |
| Interquartile 25% (IQ1) | 25.1% | 29.9% |
| Interquartile 75% (IQ3) | 41.0% | 45.3% |
| Interquartile Range (IQR) | 15.9% | 15.5% |
| Standard Deviation (Sample) | 11.5% | 17.9% |
| Standard Deviation (Population) | 11.2% | 17.8% |
Similar Demographics by Associate's Degree
Demographics Similar to Marshallese by Associate's Degree
In terms of associate's degree, the demographic groups most similar to Marshallese are Nicaraguan (41.5%, a difference of 0.13%), Malaysian (41.6%, a difference of 0.19%), Bahamian (41.5%, a difference of 0.22%), Immigrants from Jamaica (41.5%, a difference of 0.24%), and Osage (41.5%, a difference of 0.25%).
| Demographics | Rating | Rank | Associate's Degree |
| Indonesians | 0.6 /100 | #253 | Tragic 41.9% |
| Cubans | 0.6 /100 | #254 | Tragic 41.9% |
| Immigrants | Guyana | 0.5 /100 | #255 | Tragic 41.8% |
| Immigrants | Congo | 0.5 /100 | #256 | Tragic 41.8% |
| Spanish Americans | 0.5 /100 | #257 | Tragic 41.8% |
| Japanese | 0.5 /100 | #258 | Tragic 41.7% |
| Malaysians | 0.4 /100 | #259 | Tragic 41.6% |
| Marshallese | 0.4 /100 | #260 | Tragic 41.6% |
| Nicaraguans | 0.4 /100 | #261 | Tragic 41.5% |
| Bahamians | 0.4 /100 | #262 | Tragic 41.5% |
| Immigrants | Jamaica | 0.3 /100 | #263 | Tragic 41.5% |
| Osage | 0.3 /100 | #264 | Tragic 41.5% |
| Africans | 0.2 /100 | #265 | Tragic 41.1% |
| Samoans | 0.2 /100 | #266 | Tragic 41.1% |
| Hawaiians | 0.2 /100 | #267 | Tragic 40.9% |
Demographics Similar to Scotch-Irish by Associate's Degree
In terms of associate's degree, the demographic groups most similar to Scotch-Irish are Immigrants from Bangladesh (45.2%, a difference of 0.10%), Immigrants from Senegal (45.2%, a difference of 0.12%), Senegalese (45.2%, a difference of 0.13%), Immigrants from Vietnam (45.2%, a difference of 0.16%), and Spaniard (45.2%, a difference of 0.21%).
| Demographics | Rating | Rank | Associate's Degree |
| Vietnamese | 34.0 /100 | #190 | Fair 45.8% |
| Koreans | 33.8 /100 | #191 | Fair 45.8% |
| Celtics | 33.3 /100 | #192 | Fair 45.8% |
| Immigrants | Cameroon | 31.0 /100 | #193 | Fair 45.7% |
| Immigrants | Peru | 27.6 /100 | #194 | Fair 45.5% |
| Germans | 26.5 /100 | #195 | Fair 45.5% |
| French | 25.6 /100 | #196 | Fair 45.4% |
| Scotch-Irish | 22.3 /100 | #197 | Fair 45.3% |
| Immigrants | Bangladesh | 21.3 /100 | #198 | Fair 45.2% |
| Immigrants | Senegal | 21.2 /100 | #199 | Fair 45.2% |
| Senegalese | 21.1 /100 | #200 | Fair 45.2% |
| Immigrants | Vietnam | 20.8 /100 | #201 | Fair 45.2% |
| Spaniards | 20.4 /100 | #202 | Fair 45.2% |
| Immigrants | South Eastern Asia | 20.2 /100 | #203 | Fair 45.2% |
| Nigerians | 19.1 /100 | #204 | Poor 45.1% |