Immigrants from Yemen vs Tsimshian Associate's Degree
COMPARE
Immigrants from Yemen
Tsimshian
Associate's Degree
Associate's Degree Comparison
Immigrants from Yemen
Tsimshian
37.3%
ASSOCIATE'S DEGREE
0.0/ 100
METRIC RATING
321st/ 347
METRIC RANK
38.6%
ASSOCIATE'S DEGREE
0.0/ 100
METRIC RATING
301st/ 347
METRIC RANK
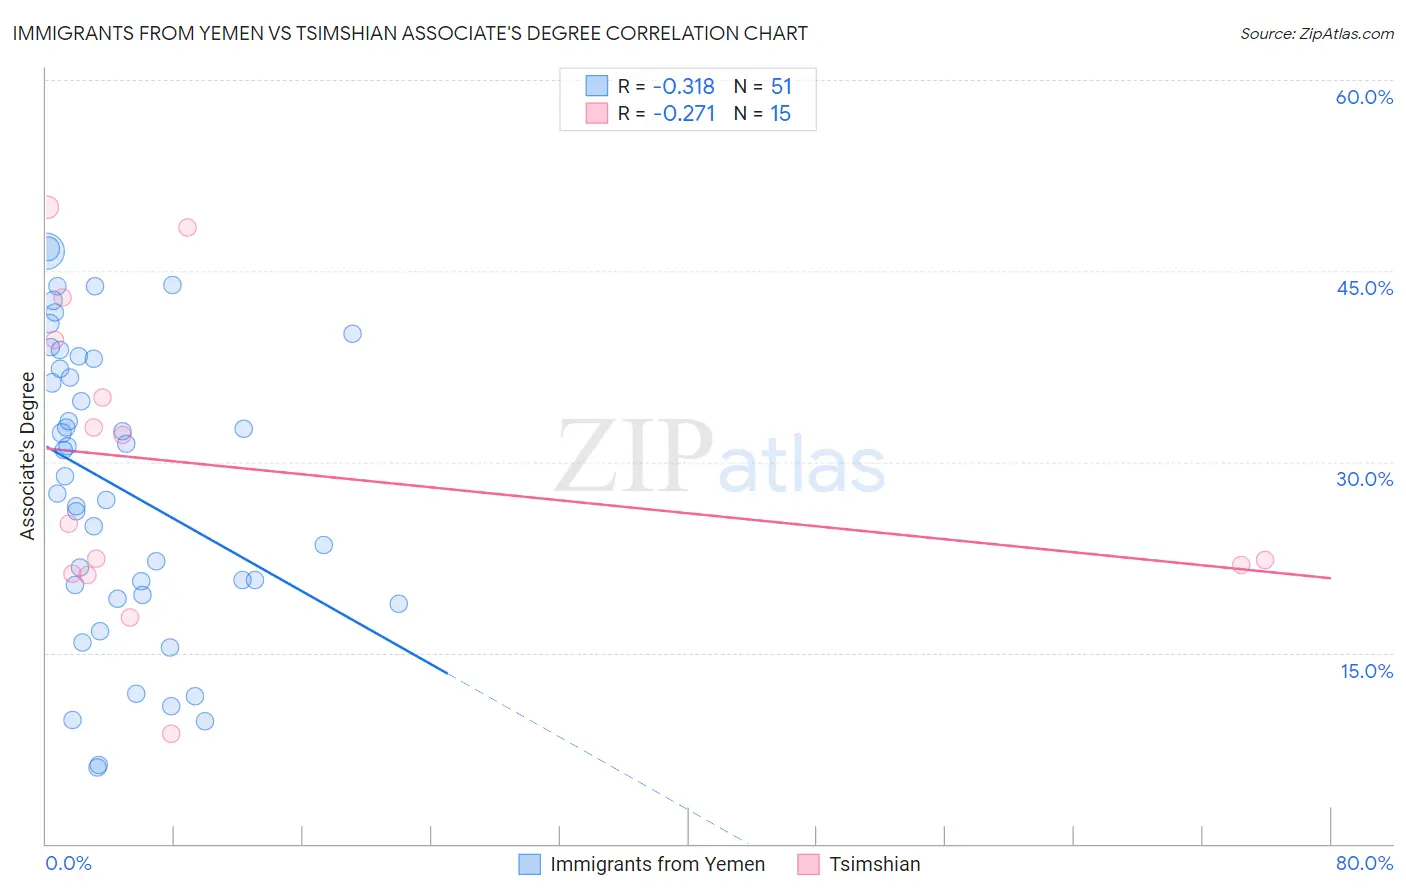
Immigrants from Yemen vs Tsimshian Associate's Degree Correlation Chart
The statistical analysis conducted on geographies consisting of 82,433,611 people shows a mild negative correlation between the proportion of Immigrants from Yemen and percentage of population with at least associate's degree education in the United States with a correlation coefficient (R) of -0.318 and weighted average of 37.3%. Similarly, the statistical analysis conducted on geographies consisting of 15,626,544 people shows a weak negative correlation between the proportion of Tsimshian and percentage of population with at least associate's degree education in the United States with a correlation coefficient (R) of -0.271 and weighted average of 38.6%, a difference of 3.4%.
Associate's Degree Correlation Summary
| Measurement | Immigrants from Yemen | Tsimshian |
| Minimum | 6.0% | 8.6% |
| Maximum | 46.7% | 50.0% |
| Range | 40.7% | 41.4% |
| Mean | 28.0% | 29.4% |
| Median | 28.8% | 25.2% |
| Interquartile 25% (IQ1) | 19.5% | 21.2% |
| Interquartile 75% (IQ3) | 38.1% | 39.6% |
| Interquartile Range (IQR) | 18.6% | 18.4% |
| Standard Deviation (Sample) | 11.4% | 12.0% |
| Standard Deviation (Population) | 11.3% | 11.5% |
Demographics Similar to Immigrants from Yemen and Tsimshian by Associate's Degree
In terms of associate's degree, the demographic groups most similar to Immigrants from Yemen are Cajun (37.4%, a difference of 0.12%), Fijian (37.4%, a difference of 0.15%), Alaska Native (37.5%, a difference of 0.37%), Yaqui (37.6%, a difference of 0.60%), and Crow (37.6%, a difference of 0.62%). Similarly, the demographic groups most similar to Tsimshian are Colville (38.5%, a difference of 0.15%), Guatemalan (38.5%, a difference of 0.24%), Sioux (38.5%, a difference of 0.29%), Immigrants from Honduras (38.5%, a difference of 0.36%), and Shoshone (38.4%, a difference of 0.42%).
| Demographics | Rating | Rank | Associate's Degree |
| Tsimshian | 0.0 /100 | #301 | Tragic 38.6% |
| Colville | 0.0 /100 | #302 | Tragic 38.5% |
| Guatemalans | 0.0 /100 | #303 | Tragic 38.5% |
| Sioux | 0.0 /100 | #304 | Tragic 38.5% |
| Immigrants | Honduras | 0.0 /100 | #305 | Tragic 38.5% |
| Shoshone | 0.0 /100 | #306 | Tragic 38.4% |
| Immigrants | El Salvador | 0.0 /100 | #307 | Tragic 38.4% |
| Mexican American Indians | 0.0 /100 | #308 | Tragic 38.2% |
| Immigrants | Guatemala | 0.0 /100 | #309 | Tragic 38.1% |
| Immigrants | Dominican Republic | 0.0 /100 | #310 | Tragic 37.9% |
| Immigrants | Latin America | 0.0 /100 | #311 | Tragic 37.9% |
| Choctaw | 0.0 /100 | #312 | Tragic 37.8% |
| Hispanics or Latinos | 0.0 /100 | #313 | Tragic 37.7% |
| Seminole | 0.0 /100 | #314 | Tragic 37.7% |
| Creek | 0.0 /100 | #315 | Tragic 37.6% |
| Crow | 0.0 /100 | #316 | Tragic 37.6% |
| Yaqui | 0.0 /100 | #317 | Tragic 37.6% |
| Alaska Natives | 0.0 /100 | #318 | Tragic 37.5% |
| Fijians | 0.0 /100 | #319 | Tragic 37.4% |
| Cajuns | 0.0 /100 | #320 | Tragic 37.4% |
| Immigrants | Yemen | 0.0 /100 | #321 | Tragic 37.3% |