Vietnamese vs Tsimshian Associate's Degree
COMPARE
Vietnamese
Tsimshian
Associate's Degree
Associate's Degree Comparison
Vietnamese
Tsimshian
45.8%
ASSOCIATE'S DEGREE
34.0/ 100
METRIC RATING
190th/ 347
METRIC RANK
38.6%
ASSOCIATE'S DEGREE
0.0/ 100
METRIC RATING
301st/ 347
METRIC RANK
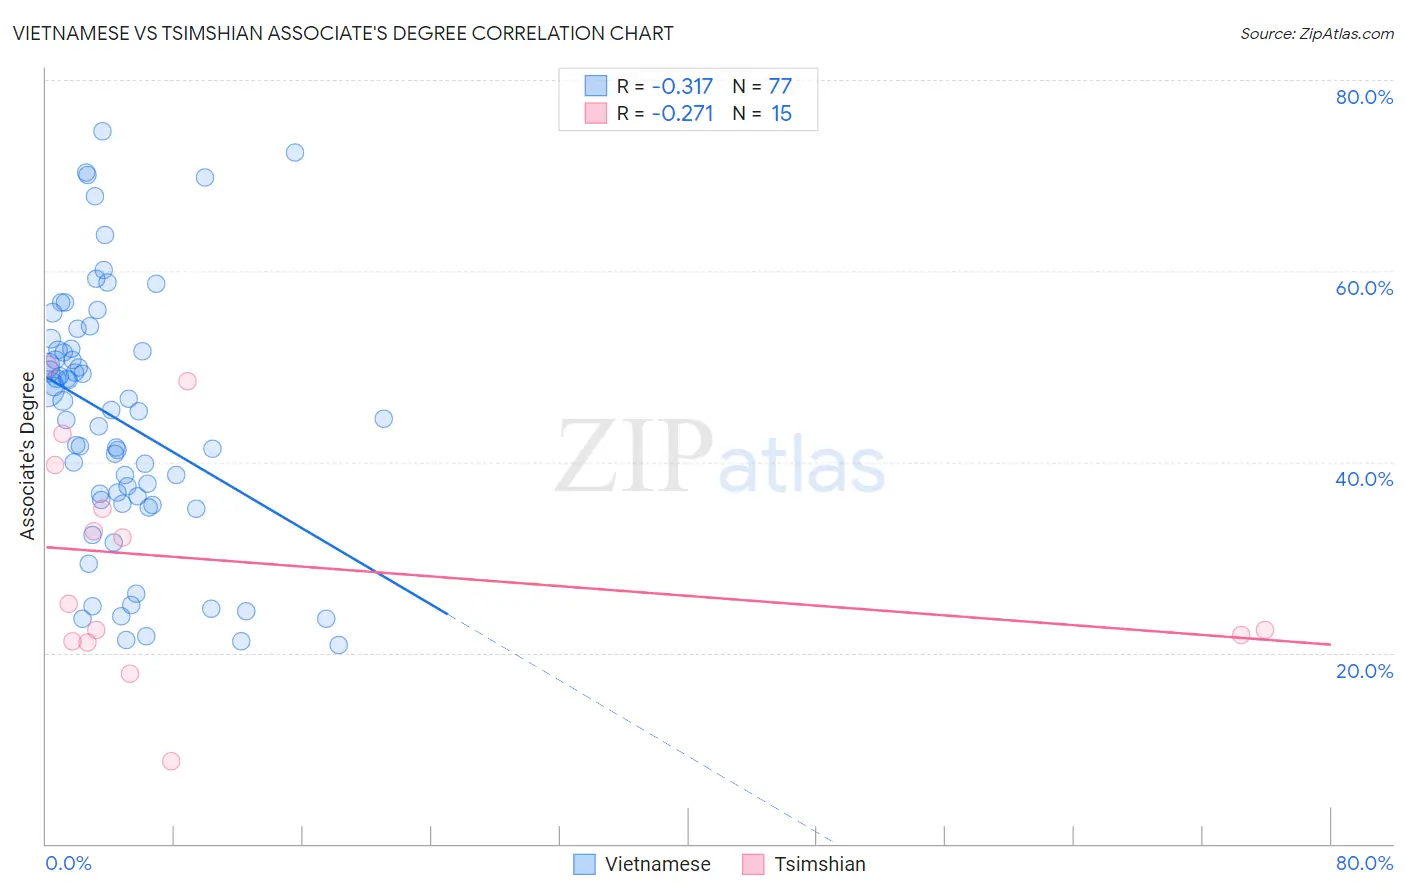
Vietnamese vs Tsimshian Associate's Degree Correlation Chart
The statistical analysis conducted on geographies consisting of 170,748,641 people shows a mild negative correlation between the proportion of Vietnamese and percentage of population with at least associate's degree education in the United States with a correlation coefficient (R) of -0.317 and weighted average of 45.8%. Similarly, the statistical analysis conducted on geographies consisting of 15,626,544 people shows a weak negative correlation between the proportion of Tsimshian and percentage of population with at least associate's degree education in the United States with a correlation coefficient (R) of -0.271 and weighted average of 38.6%, a difference of 18.6%.
Associate's Degree Correlation Summary
| Measurement | Vietnamese | Tsimshian |
| Minimum | 20.8% | 8.6% |
| Maximum | 74.6% | 50.0% |
| Range | 53.9% | 41.4% |
| Mean | 44.4% | 29.4% |
| Median | 45.3% | 25.2% |
| Interquartile 25% (IQ1) | 35.8% | 21.2% |
| Interquartile 75% (IQ3) | 51.8% | 39.6% |
| Interquartile Range (IQR) | 16.0% | 18.4% |
| Standard Deviation (Sample) | 13.3% | 12.0% |
| Standard Deviation (Population) | 13.2% | 11.5% |
Similar Demographics by Associate's Degree
Demographics Similar to Vietnamese by Associate's Degree
In terms of associate's degree, the demographic groups most similar to Vietnamese are Korean (45.8%, a difference of 0.020%), Immigrants from Oceania (45.8%, a difference of 0.060%), Celtic (45.8%, a difference of 0.060%), Immigrants from Uruguay (45.8%, a difference of 0.12%), and Ghanaian (45.8%, a difference of 0.12%).
| Demographics | Rating | Rank | Associate's Degree |
| Yugoslavians | 40.2 /100 | #183 | Average 46.0% |
| Czechoslovakians | 40.0 /100 | #184 | Average 46.0% |
| Costa Ricans | 38.6 /100 | #185 | Fair 46.0% |
| Welsh | 37.9 /100 | #186 | Fair 45.9% |
| Immigrants | Uruguay | 35.5 /100 | #187 | Fair 45.8% |
| Ghanaians | 35.5 /100 | #188 | Fair 45.8% |
| Immigrants | Oceania | 34.7 /100 | #189 | Fair 45.8% |
| Vietnamese | 34.0 /100 | #190 | Fair 45.8% |
| Koreans | 33.8 /100 | #191 | Fair 45.8% |
| Celtics | 33.3 /100 | #192 | Fair 45.8% |
| Immigrants | Cameroon | 31.0 /100 | #193 | Fair 45.7% |
| Immigrants | Peru | 27.6 /100 | #194 | Fair 45.5% |
| Germans | 26.5 /100 | #195 | Fair 45.5% |
| French | 25.6 /100 | #196 | Fair 45.4% |
| Scotch-Irish | 22.3 /100 | #197 | Fair 45.3% |
Demographics Similar to Tsimshian by Associate's Degree
In terms of associate's degree, the demographic groups most similar to Tsimshian are Chickasaw (38.6%, a difference of 0.060%), Ute (38.6%, a difference of 0.090%), Colville (38.5%, a difference of 0.15%), Cheyenne (38.7%, a difference of 0.19%), and Guatemalan (38.5%, a difference of 0.24%).
| Demographics | Rating | Rank | Associate's Degree |
| Salvadorans | 0.0 /100 | #294 | Tragic 39.0% |
| Hondurans | 0.0 /100 | #295 | Tragic 38.9% |
| Cherokee | 0.0 /100 | #296 | Tragic 38.9% |
| Cape Verdeans | 0.0 /100 | #297 | Tragic 38.8% |
| Cheyenne | 0.0 /100 | #298 | Tragic 38.7% |
| Ute | 0.0 /100 | #299 | Tragic 38.6% |
| Chickasaw | 0.0 /100 | #300 | Tragic 38.6% |
| Tsimshian | 0.0 /100 | #301 | Tragic 38.6% |
| Colville | 0.0 /100 | #302 | Tragic 38.5% |
| Guatemalans | 0.0 /100 | #303 | Tragic 38.5% |
| Sioux | 0.0 /100 | #304 | Tragic 38.5% |
| Immigrants | Honduras | 0.0 /100 | #305 | Tragic 38.5% |
| Shoshone | 0.0 /100 | #306 | Tragic 38.4% |
| Immigrants | El Salvador | 0.0 /100 | #307 | Tragic 38.4% |
| Mexican American Indians | 0.0 /100 | #308 | Tragic 38.2% |