Marshallese vs Immigrants from Asia Associate's Degree
COMPARE
Marshallese
Immigrants from Asia
Associate's Degree
Associate's Degree Comparison
Marshallese
Immigrants from Asia
41.6%
ASSOCIATE'S DEGREE
0.4/ 100
METRIC RATING
260th/ 347
METRIC RANK
52.0%
ASSOCIATE'S DEGREE
99.8/ 100
METRIC RATING
53rd/ 347
METRIC RANK
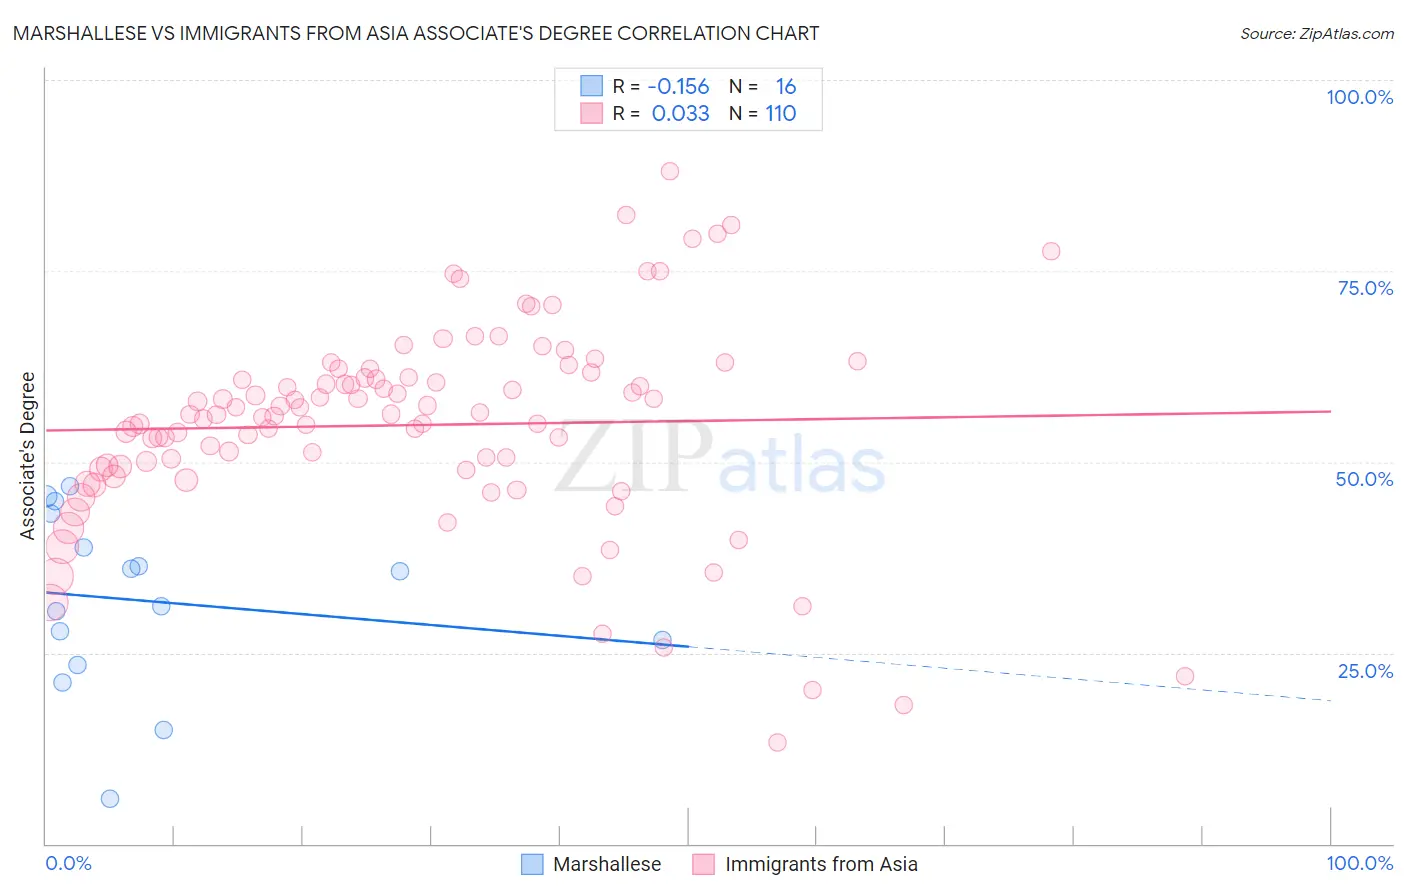
Marshallese vs Immigrants from Asia Associate's Degree Correlation Chart
The statistical analysis conducted on geographies consisting of 14,761,315 people shows a poor negative correlation between the proportion of Marshallese and percentage of population with at least associate's degree education in the United States with a correlation coefficient (R) of -0.156 and weighted average of 41.6%. Similarly, the statistical analysis conducted on geographies consisting of 549,095,102 people shows no correlation between the proportion of Immigrants from Asia and percentage of population with at least associate's degree education in the United States with a correlation coefficient (R) of 0.033 and weighted average of 52.0%, a difference of 25.0%.
Associate's Degree Correlation Summary
| Measurement | Marshallese | Immigrants from Asia |
| Minimum | 5.9% | 13.2% |
| Maximum | 46.8% | 88.0% |
| Range | 40.9% | 74.8% |
| Mean | 31.8% | 54.8% |
| Median | 33.4% | 56.2% |
| Interquartile 25% (IQ1) | 25.1% | 49.0% |
| Interquartile 75% (IQ3) | 41.0% | 61.1% |
| Interquartile Range (IQR) | 15.9% | 12.0% |
| Standard Deviation (Sample) | 11.5% | 13.4% |
| Standard Deviation (Population) | 11.2% | 13.4% |
Similar Demographics by Associate's Degree
Demographics Similar to Marshallese by Associate's Degree
In terms of associate's degree, the demographic groups most similar to Marshallese are Nicaraguan (41.5%, a difference of 0.13%), Malaysian (41.6%, a difference of 0.19%), Bahamian (41.5%, a difference of 0.22%), Immigrants from Jamaica (41.5%, a difference of 0.24%), and Osage (41.5%, a difference of 0.25%).
| Demographics | Rating | Rank | Associate's Degree |
| Indonesians | 0.6 /100 | #253 | Tragic 41.9% |
| Cubans | 0.6 /100 | #254 | Tragic 41.9% |
| Immigrants | Guyana | 0.5 /100 | #255 | Tragic 41.8% |
| Immigrants | Congo | 0.5 /100 | #256 | Tragic 41.8% |
| Spanish Americans | 0.5 /100 | #257 | Tragic 41.8% |
| Japanese | 0.5 /100 | #258 | Tragic 41.7% |
| Malaysians | 0.4 /100 | #259 | Tragic 41.6% |
| Marshallese | 0.4 /100 | #260 | Tragic 41.6% |
| Nicaraguans | 0.4 /100 | #261 | Tragic 41.5% |
| Bahamians | 0.4 /100 | #262 | Tragic 41.5% |
| Immigrants | Jamaica | 0.3 /100 | #263 | Tragic 41.5% |
| Osage | 0.3 /100 | #264 | Tragic 41.5% |
| Africans | 0.2 /100 | #265 | Tragic 41.1% |
| Samoans | 0.2 /100 | #266 | Tragic 41.1% |
| Hawaiians | 0.2 /100 | #267 | Tragic 40.9% |
Demographics Similar to Immigrants from Asia by Associate's Degree
In terms of associate's degree, the demographic groups most similar to Immigrants from Asia are Bolivian (52.0%, a difference of 0.020%), Immigrants from Spain (51.9%, a difference of 0.10%), Australian (51.9%, a difference of 0.13%), Immigrants from Czechoslovakia (51.9%, a difference of 0.15%), and Immigrants from Greece (52.1%, a difference of 0.23%).
| Demographics | Rating | Rank | Associate's Degree |
| Immigrants | Bulgaria | 99.9 /100 | #46 | Exceptional 52.4% |
| Immigrants | Kuwait | 99.9 /100 | #47 | Exceptional 52.4% |
| Immigrants | Norway | 99.9 /100 | #48 | Exceptional 52.2% |
| Immigrants | Austria | 99.9 /100 | #49 | Exceptional 52.1% |
| Asians | 99.9 /100 | #50 | Exceptional 52.1% |
| Immigrants | Greece | 99.9 /100 | #51 | Exceptional 52.1% |
| Bolivians | 99.8 /100 | #52 | Exceptional 52.0% |
| Immigrants | Asia | 99.8 /100 | #53 | Exceptional 52.0% |
| Immigrants | Spain | 99.8 /100 | #54 | Exceptional 51.9% |
| Australians | 99.8 /100 | #55 | Exceptional 51.9% |
| Immigrants | Czechoslovakia | 99.8 /100 | #56 | Exceptional 51.9% |
| Paraguayans | 99.8 /100 | #57 | Exceptional 51.8% |
| New Zealanders | 99.8 /100 | #58 | Exceptional 51.8% |
| Immigrants | Serbia | 99.8 /100 | #59 | Exceptional 51.7% |
| Immigrants | Bolivia | 99.7 /100 | #60 | Exceptional 51.5% |