Marshallese vs Vietnamese Associate's Degree
COMPARE
Marshallese
Vietnamese
Associate's Degree
Associate's Degree Comparison
Marshallese
Vietnamese
41.6%
ASSOCIATE'S DEGREE
0.4/ 100
METRIC RATING
260th/ 347
METRIC RANK
45.8%
ASSOCIATE'S DEGREE
34.0/ 100
METRIC RATING
190th/ 347
METRIC RANK
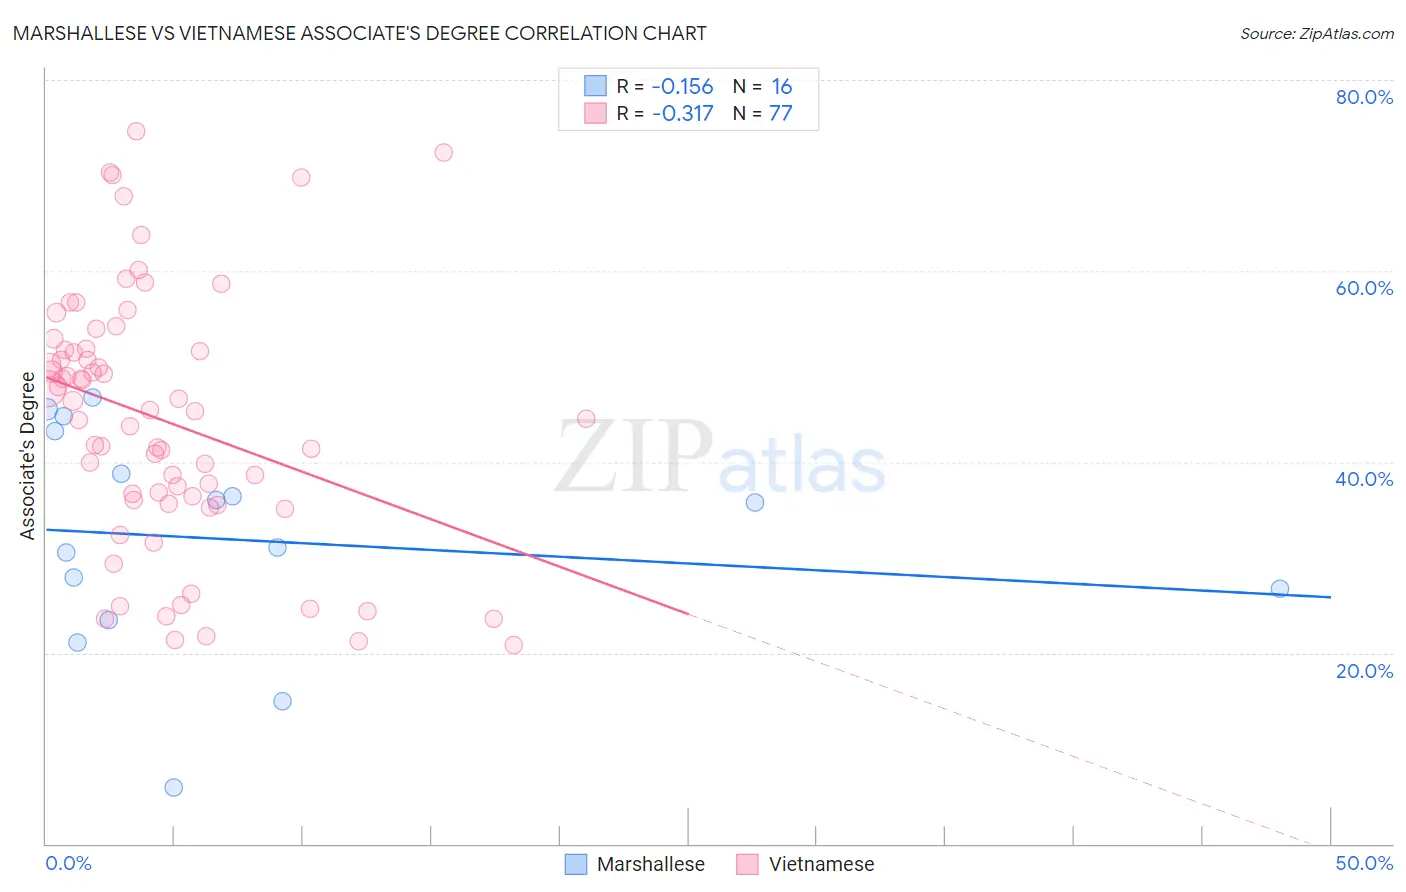
Marshallese vs Vietnamese Associate's Degree Correlation Chart
The statistical analysis conducted on geographies consisting of 14,761,315 people shows a poor negative correlation between the proportion of Marshallese and percentage of population with at least associate's degree education in the United States with a correlation coefficient (R) of -0.156 and weighted average of 41.6%. Similarly, the statistical analysis conducted on geographies consisting of 170,748,641 people shows a mild negative correlation between the proportion of Vietnamese and percentage of population with at least associate's degree education in the United States with a correlation coefficient (R) of -0.317 and weighted average of 45.8%, a difference of 10.2%.
Associate's Degree Correlation Summary
| Measurement | Marshallese | Vietnamese |
| Minimum | 5.9% | 20.8% |
| Maximum | 46.8% | 74.6% |
| Range | 40.9% | 53.9% |
| Mean | 31.8% | 44.4% |
| Median | 33.4% | 45.3% |
| Interquartile 25% (IQ1) | 25.1% | 35.8% |
| Interquartile 75% (IQ3) | 41.0% | 51.8% |
| Interquartile Range (IQR) | 15.9% | 16.0% |
| Standard Deviation (Sample) | 11.5% | 13.3% |
| Standard Deviation (Population) | 11.2% | 13.2% |
Similar Demographics by Associate's Degree
Demographics Similar to Marshallese by Associate's Degree
In terms of associate's degree, the demographic groups most similar to Marshallese are Nicaraguan (41.5%, a difference of 0.13%), Malaysian (41.6%, a difference of 0.19%), Bahamian (41.5%, a difference of 0.22%), Immigrants from Jamaica (41.5%, a difference of 0.24%), and Osage (41.5%, a difference of 0.25%).
| Demographics | Rating | Rank | Associate's Degree |
| Indonesians | 0.6 /100 | #253 | Tragic 41.9% |
| Cubans | 0.6 /100 | #254 | Tragic 41.9% |
| Immigrants | Guyana | 0.5 /100 | #255 | Tragic 41.8% |
| Immigrants | Congo | 0.5 /100 | #256 | Tragic 41.8% |
| Spanish Americans | 0.5 /100 | #257 | Tragic 41.8% |
| Japanese | 0.5 /100 | #258 | Tragic 41.7% |
| Malaysians | 0.4 /100 | #259 | Tragic 41.6% |
| Marshallese | 0.4 /100 | #260 | Tragic 41.6% |
| Nicaraguans | 0.4 /100 | #261 | Tragic 41.5% |
| Bahamians | 0.4 /100 | #262 | Tragic 41.5% |
| Immigrants | Jamaica | 0.3 /100 | #263 | Tragic 41.5% |
| Osage | 0.3 /100 | #264 | Tragic 41.5% |
| Africans | 0.2 /100 | #265 | Tragic 41.1% |
| Samoans | 0.2 /100 | #266 | Tragic 41.1% |
| Hawaiians | 0.2 /100 | #267 | Tragic 40.9% |
Demographics Similar to Vietnamese by Associate's Degree
In terms of associate's degree, the demographic groups most similar to Vietnamese are Korean (45.8%, a difference of 0.020%), Immigrants from Oceania (45.8%, a difference of 0.060%), Celtic (45.8%, a difference of 0.060%), Immigrants from Uruguay (45.8%, a difference of 0.12%), and Ghanaian (45.8%, a difference of 0.12%).
| Demographics | Rating | Rank | Associate's Degree |
| Yugoslavians | 40.2 /100 | #183 | Average 46.0% |
| Czechoslovakians | 40.0 /100 | #184 | Average 46.0% |
| Costa Ricans | 38.6 /100 | #185 | Fair 46.0% |
| Welsh | 37.9 /100 | #186 | Fair 45.9% |
| Immigrants | Uruguay | 35.5 /100 | #187 | Fair 45.8% |
| Ghanaians | 35.5 /100 | #188 | Fair 45.8% |
| Immigrants | Oceania | 34.7 /100 | #189 | Fair 45.8% |
| Vietnamese | 34.0 /100 | #190 | Fair 45.8% |
| Koreans | 33.8 /100 | #191 | Fair 45.8% |
| Celtics | 33.3 /100 | #192 | Fair 45.8% |
| Immigrants | Cameroon | 31.0 /100 | #193 | Fair 45.7% |
| Immigrants | Peru | 27.6 /100 | #194 | Fair 45.5% |
| Germans | 26.5 /100 | #195 | Fair 45.5% |
| French | 25.6 /100 | #196 | Fair 45.4% |
| Scotch-Irish | 22.3 /100 | #197 | Fair 45.3% |