Macedonian vs Immigrants from Argentina 8th Grade
COMPARE
Macedonian
Immigrants from Argentina
8th Grade
8th Grade Comparison
Macedonians
Immigrants from Argentina
96.7%
8TH GRADE
99.8/ 100
METRIC RATING
57th/ 347
METRIC RANK
95.5%
8TH GRADE
20.6/ 100
METRIC RATING
201st/ 347
METRIC RANK
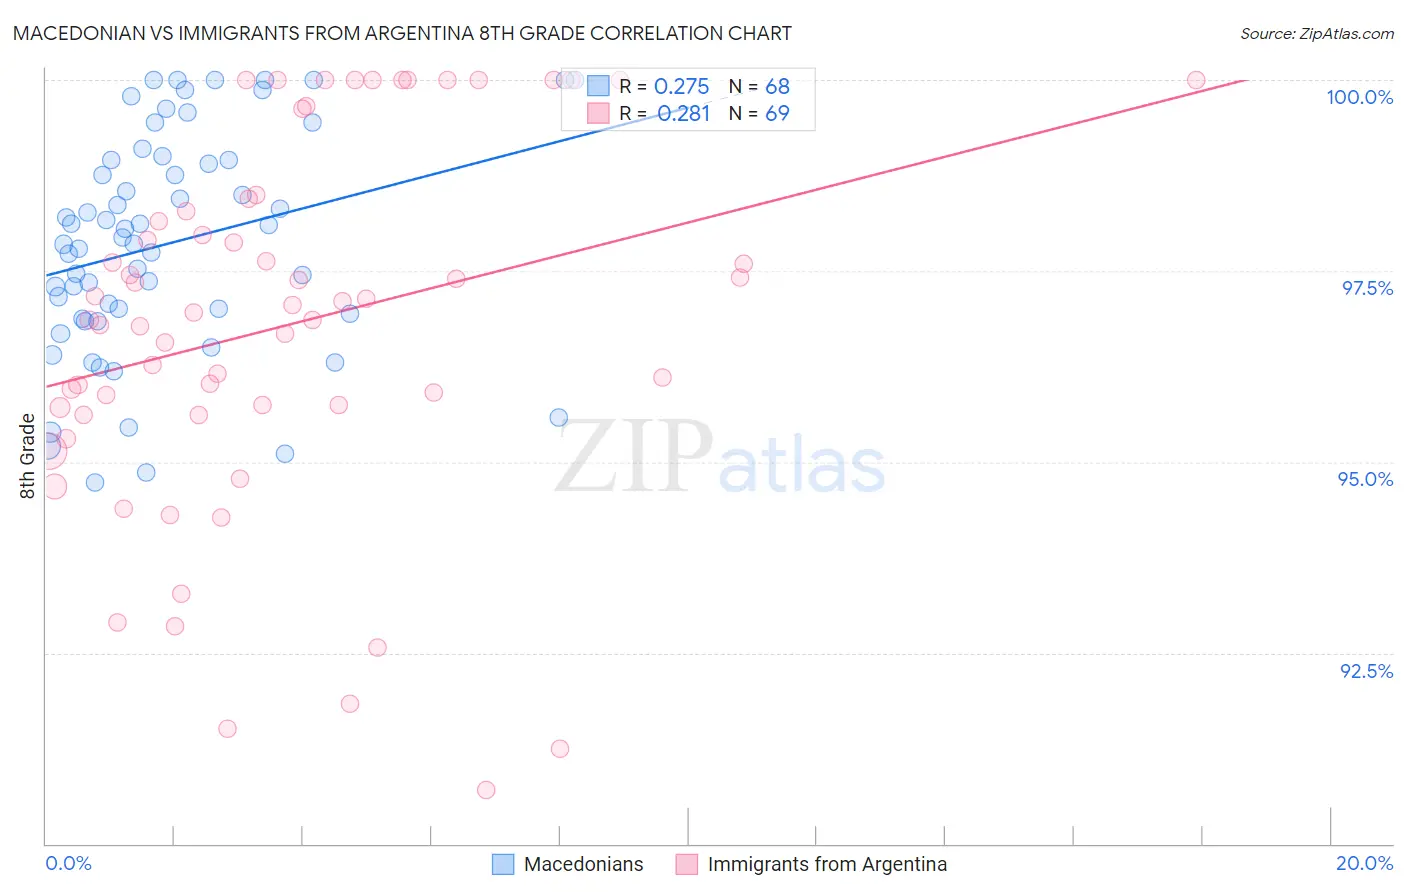
Macedonian vs Immigrants from Argentina 8th Grade Correlation Chart
The statistical analysis conducted on geographies consisting of 132,592,860 people shows a weak positive correlation between the proportion of Macedonians and percentage of population with at least 8th grade education in the United States with a correlation coefficient (R) of 0.275 and weighted average of 96.7%. Similarly, the statistical analysis conducted on geographies consisting of 264,437,906 people shows a weak positive correlation between the proportion of Immigrants from Argentina and percentage of population with at least 8th grade education in the United States with a correlation coefficient (R) of 0.281 and weighted average of 95.5%, a difference of 1.3%.
8th Grade Correlation Summary
| Measurement | Macedonian | Immigrants from Argentina |
| Minimum | 94.7% | 90.7% |
| Maximum | 100.0% | 100.0% |
| Range | 5.3% | 9.3% |
| Mean | 97.9% | 96.8% |
| Median | 97.9% | 97.0% |
| Interquartile 25% (IQ1) | 96.9% | 95.7% |
| Interquartile 75% (IQ3) | 99.0% | 98.4% |
| Interquartile Range (IQR) | 2.0% | 2.7% |
| Standard Deviation (Sample) | 1.4% | 2.4% |
| Standard Deviation (Population) | 1.4% | 2.4% |
Similar Demographics by 8th Grade
Demographics Similar to Macedonians by 8th Grade
In terms of 8th grade, the demographic groups most similar to Macedonians are Australian (96.7%, a difference of 0.0%), Austrian (96.7%, a difference of 0.010%), Serbian (96.7%, a difference of 0.010%), Russian (96.7%, a difference of 0.010%), and Greek (96.8%, a difference of 0.030%).
| Demographics | Rating | Rank | 8th Grade |
| Immigrants | Scotland | 99.9 /100 | #50 | Exceptional 96.8% |
| Celtics | 99.9 /100 | #51 | Exceptional 96.8% |
| Greeks | 99.9 /100 | #52 | Exceptional 96.8% |
| Austrians | 99.9 /100 | #53 | Exceptional 96.7% |
| Serbians | 99.8 /100 | #54 | Exceptional 96.7% |
| Russians | 99.8 /100 | #55 | Exceptional 96.7% |
| Australians | 99.8 /100 | #56 | Exceptional 96.7% |
| Macedonians | 99.8 /100 | #57 | Exceptional 96.7% |
| Immigrants | Canada | 99.8 /100 | #58 | Exceptional 96.7% |
| Immigrants | North America | 99.8 /100 | #59 | Exceptional 96.7% |
| Immigrants | Northern Europe | 99.8 /100 | #60 | Exceptional 96.7% |
| Immigrants | Austria | 99.8 /100 | #61 | Exceptional 96.7% |
| Whites/Caucasians | 99.8 /100 | #62 | Exceptional 96.7% |
| Ukrainians | 99.7 /100 | #63 | Exceptional 96.7% |
| Immigrants | India | 99.7 /100 | #64 | Exceptional 96.6% |
Demographics Similar to Immigrants from Argentina by 8th Grade
In terms of 8th grade, the demographic groups most similar to Immigrants from Argentina are Apache (95.5%, a difference of 0.010%), Paraguayan (95.5%, a difference of 0.020%), Immigrants from Northern Africa (95.5%, a difference of 0.020%), Argentinean (95.5%, a difference of 0.020%), and Sierra Leonean (95.6%, a difference of 0.030%).
| Demographics | Rating | Rank | 8th Grade |
| Guamanians/Chamorros | 26.6 /100 | #194 | Fair 95.6% |
| Immigrants | Zaire | 25.2 /100 | #195 | Fair 95.6% |
| Assyrians/Chaldeans/Syriacs | 24.5 /100 | #196 | Fair 95.6% |
| Sierra Leoneans | 24.3 /100 | #197 | Fair 95.6% |
| Paraguayans | 22.6 /100 | #198 | Fair 95.5% |
| Immigrants | Northern Africa | 22.5 /100 | #199 | Fair 95.5% |
| Argentineans | 22.2 /100 | #200 | Fair 95.5% |
| Immigrants | Argentina | 20.6 /100 | #201 | Fair 95.5% |
| Apache | 19.4 /100 | #202 | Poor 95.5% |
| Moroccans | 17.4 /100 | #203 | Poor 95.5% |
| Hawaiians | 16.7 /100 | #204 | Poor 95.5% |
| Immigrants | Bahamas | 16.7 /100 | #205 | Poor 95.5% |
| Comanche | 16.3 /100 | #206 | Poor 95.5% |
| Immigrants | Sudan | 15.1 /100 | #207 | Poor 95.5% |
| Portuguese | 14.3 /100 | #208 | Poor 95.5% |