Macedonian vs Immigrants from Australia 8th Grade
COMPARE
Macedonian
Immigrants from Australia
8th Grade
8th Grade Comparison
Macedonians
Immigrants from Australia
96.7%
8TH GRADE
99.8/ 100
METRIC RATING
57th/ 347
METRIC RANK
96.5%
8TH GRADE
99.0/ 100
METRIC RATING
87th/ 347
METRIC RANK
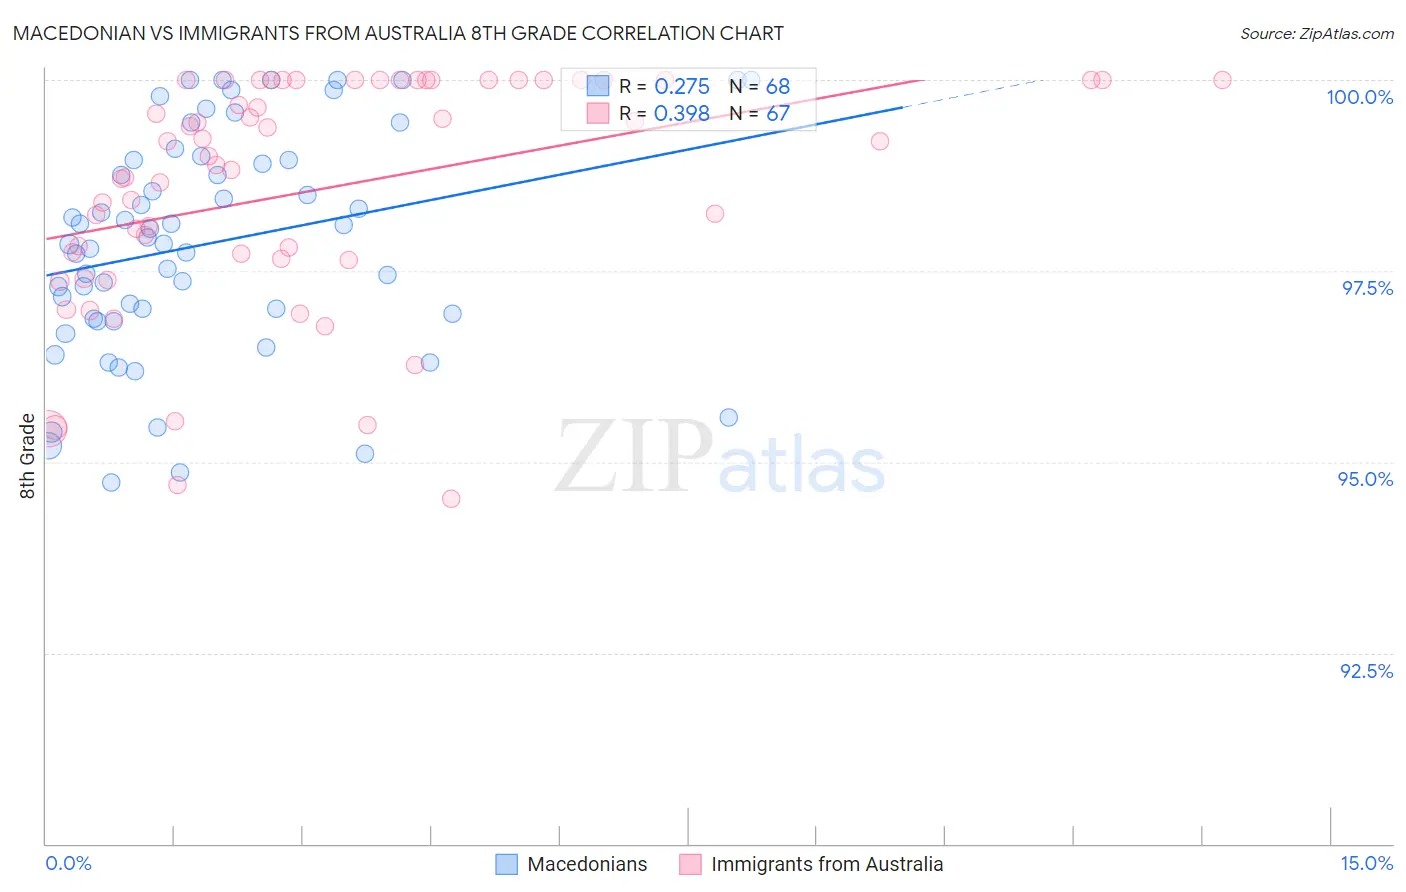
Macedonian vs Immigrants from Australia 8th Grade Correlation Chart
The statistical analysis conducted on geographies consisting of 132,592,860 people shows a weak positive correlation between the proportion of Macedonians and percentage of population with at least 8th grade education in the United States with a correlation coefficient (R) of 0.275 and weighted average of 96.7%. Similarly, the statistical analysis conducted on geographies consisting of 227,203,192 people shows a mild positive correlation between the proportion of Immigrants from Australia and percentage of population with at least 8th grade education in the United States with a correlation coefficient (R) of 0.398 and weighted average of 96.5%, a difference of 0.29%.
8th Grade Correlation Summary
| Measurement | Macedonian | Immigrants from Australia |
| Minimum | 94.7% | 94.5% |
| Maximum | 100.0% | 100.0% |
| Range | 5.3% | 5.5% |
| Mean | 97.9% | 98.6% |
| Median | 97.9% | 99.0% |
| Interquartile 25% (IQ1) | 96.9% | 97.7% |
| Interquartile 75% (IQ3) | 99.0% | 100.0% |
| Interquartile Range (IQR) | 2.0% | 2.3% |
| Standard Deviation (Sample) | 1.4% | 1.5% |
| Standard Deviation (Population) | 1.4% | 1.5% |
Similar Demographics by 8th Grade
Demographics Similar to Macedonians by 8th Grade
In terms of 8th grade, the demographic groups most similar to Macedonians are Australian (96.7%, a difference of 0.0%), Austrian (96.7%, a difference of 0.010%), Serbian (96.7%, a difference of 0.010%), Russian (96.7%, a difference of 0.010%), and Greek (96.8%, a difference of 0.030%).
| Demographics | Rating | Rank | 8th Grade |
| Immigrants | Scotland | 99.9 /100 | #50 | Exceptional 96.8% |
| Celtics | 99.9 /100 | #51 | Exceptional 96.8% |
| Greeks | 99.9 /100 | #52 | Exceptional 96.8% |
| Austrians | 99.9 /100 | #53 | Exceptional 96.7% |
| Serbians | 99.8 /100 | #54 | Exceptional 96.7% |
| Russians | 99.8 /100 | #55 | Exceptional 96.7% |
| Australians | 99.8 /100 | #56 | Exceptional 96.7% |
| Macedonians | 99.8 /100 | #57 | Exceptional 96.7% |
| Immigrants | Canada | 99.8 /100 | #58 | Exceptional 96.7% |
| Immigrants | North America | 99.8 /100 | #59 | Exceptional 96.7% |
| Immigrants | Northern Europe | 99.8 /100 | #60 | Exceptional 96.7% |
| Immigrants | Austria | 99.8 /100 | #61 | Exceptional 96.7% |
| Whites/Caucasians | 99.8 /100 | #62 | Exceptional 96.7% |
| Ukrainians | 99.7 /100 | #63 | Exceptional 96.7% |
| Immigrants | India | 99.7 /100 | #64 | Exceptional 96.6% |
Demographics Similar to Immigrants from Australia by 8th Grade
In terms of 8th grade, the demographic groups most similar to Immigrants from Australia are Immigrants from South Africa (96.5%, a difference of 0.0%), Cherokee (96.5%, a difference of 0.0%), Immigrants from Western Europe (96.4%, a difference of 0.010%), Immigrants from Belgium (96.5%, a difference of 0.020%), and Chickasaw (96.4%, a difference of 0.020%).
| Demographics | Rating | Rank | 8th Grade |
| Delaware | 99.2 /100 | #80 | Exceptional 96.5% |
| Romanians | 99.2 /100 | #81 | Exceptional 96.5% |
| Turks | 99.2 /100 | #82 | Exceptional 96.5% |
| Icelanders | 99.2 /100 | #83 | Exceptional 96.5% |
| Immigrants | Belgium | 99.1 /100 | #84 | Exceptional 96.5% |
| Immigrants | South Africa | 99.1 /100 | #85 | Exceptional 96.5% |
| Cherokee | 99.0 /100 | #86 | Exceptional 96.5% |
| Immigrants | Australia | 99.0 /100 | #87 | Exceptional 96.5% |
| Immigrants | Western Europe | 99.0 /100 | #88 | Exceptional 96.4% |
| Chickasaw | 98.9 /100 | #89 | Exceptional 96.4% |
| Immigrants | Sweden | 98.9 /100 | #90 | Exceptional 96.4% |
| Thais | 98.9 /100 | #91 | Exceptional 96.4% |
| Menominee | 98.9 /100 | #92 | Exceptional 96.4% |
| Immigrants | Denmark | 98.8 /100 | #93 | Exceptional 96.4% |
| Immigrants | Singapore | 98.8 /100 | #94 | Exceptional 96.4% |