Macedonian vs Immigrants from Spain 8th Grade
COMPARE
Macedonian
Immigrants from Spain
8th Grade
8th Grade Comparison
Macedonians
Immigrants from Spain
96.7%
8TH GRADE
99.8/ 100
METRIC RATING
57th/ 347
METRIC RANK
95.7%
8TH GRADE
38.7/ 100
METRIC RATING
181st/ 347
METRIC RANK
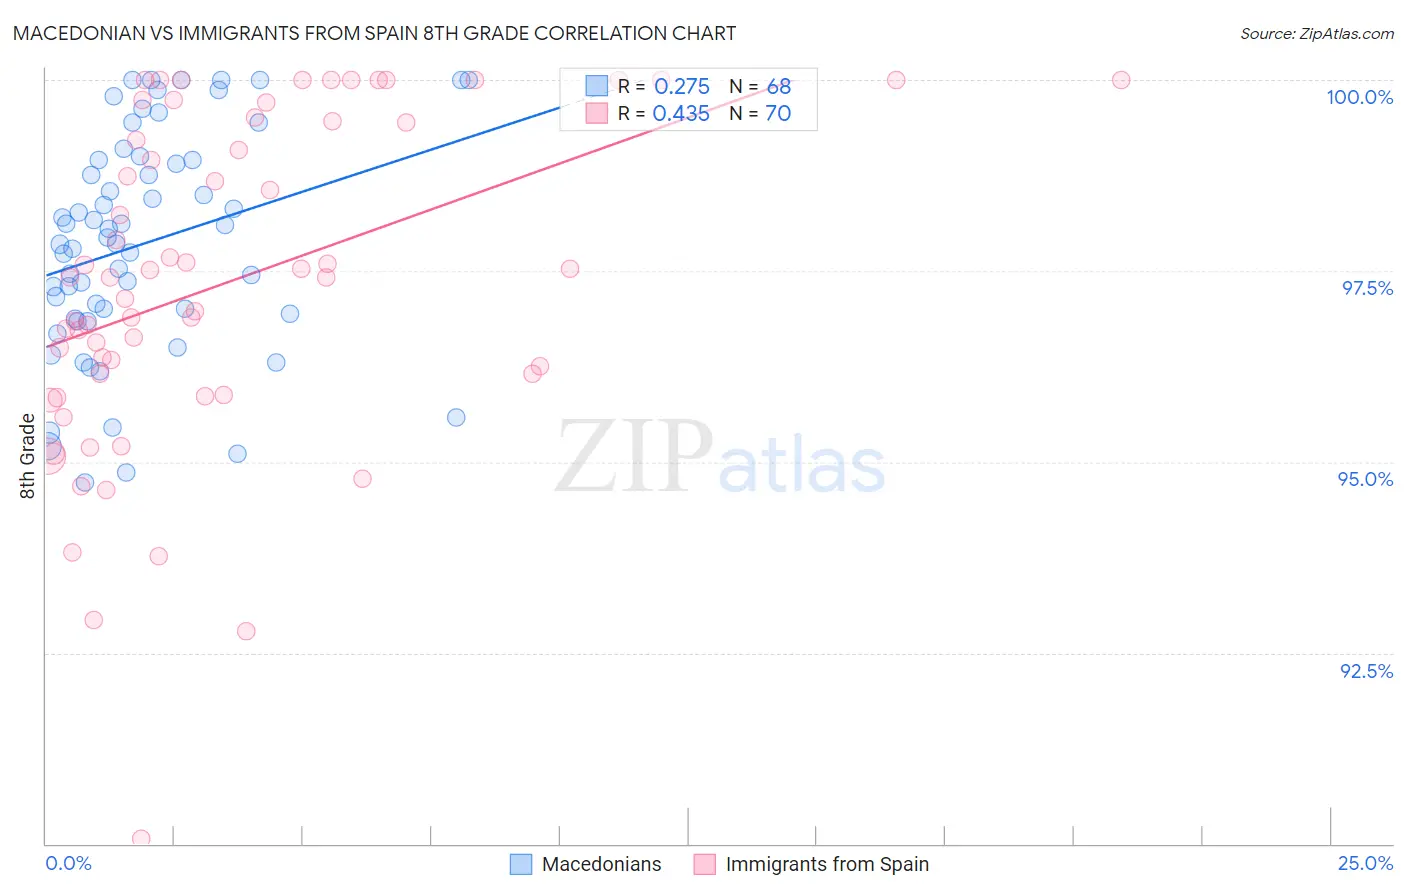
Macedonian vs Immigrants from Spain 8th Grade Correlation Chart
The statistical analysis conducted on geographies consisting of 132,592,860 people shows a weak positive correlation between the proportion of Macedonians and percentage of population with at least 8th grade education in the United States with a correlation coefficient (R) of 0.275 and weighted average of 96.7%. Similarly, the statistical analysis conducted on geographies consisting of 239,679,100 people shows a moderate positive correlation between the proportion of Immigrants from Spain and percentage of population with at least 8th grade education in the United States with a correlation coefficient (R) of 0.435 and weighted average of 95.7%, a difference of 1.1%.
8th Grade Correlation Summary
| Measurement | Macedonian | Immigrants from Spain |
| Minimum | 94.7% | 90.1% |
| Maximum | 100.0% | 100.0% |
| Range | 5.3% | 9.9% |
| Mean | 97.9% | 97.4% |
| Median | 97.9% | 97.4% |
| Interquartile 25% (IQ1) | 96.9% | 96.1% |
| Interquartile 75% (IQ3) | 99.0% | 99.5% |
| Interquartile Range (IQR) | 2.0% | 3.3% |
| Standard Deviation (Sample) | 1.4% | 2.1% |
| Standard Deviation (Population) | 1.4% | 2.1% |
Similar Demographics by 8th Grade
Demographics Similar to Macedonians by 8th Grade
In terms of 8th grade, the demographic groups most similar to Macedonians are Australian (96.7%, a difference of 0.0%), Austrian (96.7%, a difference of 0.010%), Serbian (96.7%, a difference of 0.010%), Russian (96.7%, a difference of 0.010%), and Greek (96.8%, a difference of 0.030%).
| Demographics | Rating | Rank | 8th Grade |
| Immigrants | Scotland | 99.9 /100 | #50 | Exceptional 96.8% |
| Celtics | 99.9 /100 | #51 | Exceptional 96.8% |
| Greeks | 99.9 /100 | #52 | Exceptional 96.8% |
| Austrians | 99.9 /100 | #53 | Exceptional 96.7% |
| Serbians | 99.8 /100 | #54 | Exceptional 96.7% |
| Russians | 99.8 /100 | #55 | Exceptional 96.7% |
| Australians | 99.8 /100 | #56 | Exceptional 96.7% |
| Macedonians | 99.8 /100 | #57 | Exceptional 96.7% |
| Immigrants | Canada | 99.8 /100 | #58 | Exceptional 96.7% |
| Immigrants | North America | 99.8 /100 | #59 | Exceptional 96.7% |
| Immigrants | Northern Europe | 99.8 /100 | #60 | Exceptional 96.7% |
| Immigrants | Austria | 99.8 /100 | #61 | Exceptional 96.7% |
| Whites/Caucasians | 99.8 /100 | #62 | Exceptional 96.7% |
| Ukrainians | 99.7 /100 | #63 | Exceptional 96.7% |
| Immigrants | India | 99.7 /100 | #64 | Exceptional 96.6% |
Demographics Similar to Immigrants from Spain by 8th Grade
In terms of 8th grade, the demographic groups most similar to Immigrants from Spain are Iraqi (95.7%, a difference of 0.010%), Immigrants from Egypt (95.7%, a difference of 0.010%), Immigrants from Iraq (95.6%, a difference of 0.020%), Immigrants from Uganda (95.6%, a difference of 0.020%), and Black/African American (95.6%, a difference of 0.030%).
| Demographics | Rating | Rank | 8th Grade |
| Chileans | 50.0 /100 | #174 | Average 95.7% |
| Immigrants | Albania | 49.6 /100 | #175 | Average 95.7% |
| Pakistanis | 48.8 /100 | #176 | Average 95.7% |
| Marshallese | 47.6 /100 | #177 | Average 95.7% |
| Venezuelans | 47.5 /100 | #178 | Average 95.7% |
| Immigrants | Brazil | 45.4 /100 | #179 | Average 95.7% |
| Iraqis | 40.5 /100 | #180 | Average 95.7% |
| Immigrants | Spain | 38.7 /100 | #181 | Fair 95.7% |
| Immigrants | Egypt | 37.9 /100 | #182 | Fair 95.7% |
| Immigrants | Iraq | 36.2 /100 | #183 | Fair 95.6% |
| Immigrants | Uganda | 36.0 /100 | #184 | Fair 95.6% |
| Blacks/African Americans | 34.8 /100 | #185 | Fair 95.6% |
| Brazilians | 34.8 /100 | #186 | Fair 95.6% |
| Sudanese | 33.0 /100 | #187 | Fair 95.6% |
| Liberians | 32.4 /100 | #188 | Fair 95.6% |