Macedonian vs Slavic No Schooling Completed
COMPARE
Macedonian
Slavic
No Schooling Completed
No Schooling Completed Comparison
Macedonians
Slavs
1.7%
NO SCHOOLING COMPLETED
99.3/ 100
METRIC RATING
79th/ 347
METRIC RANK
1.7%
NO SCHOOLING COMPLETED
99.8/ 100
METRIC RATING
59th/ 347
METRIC RANK
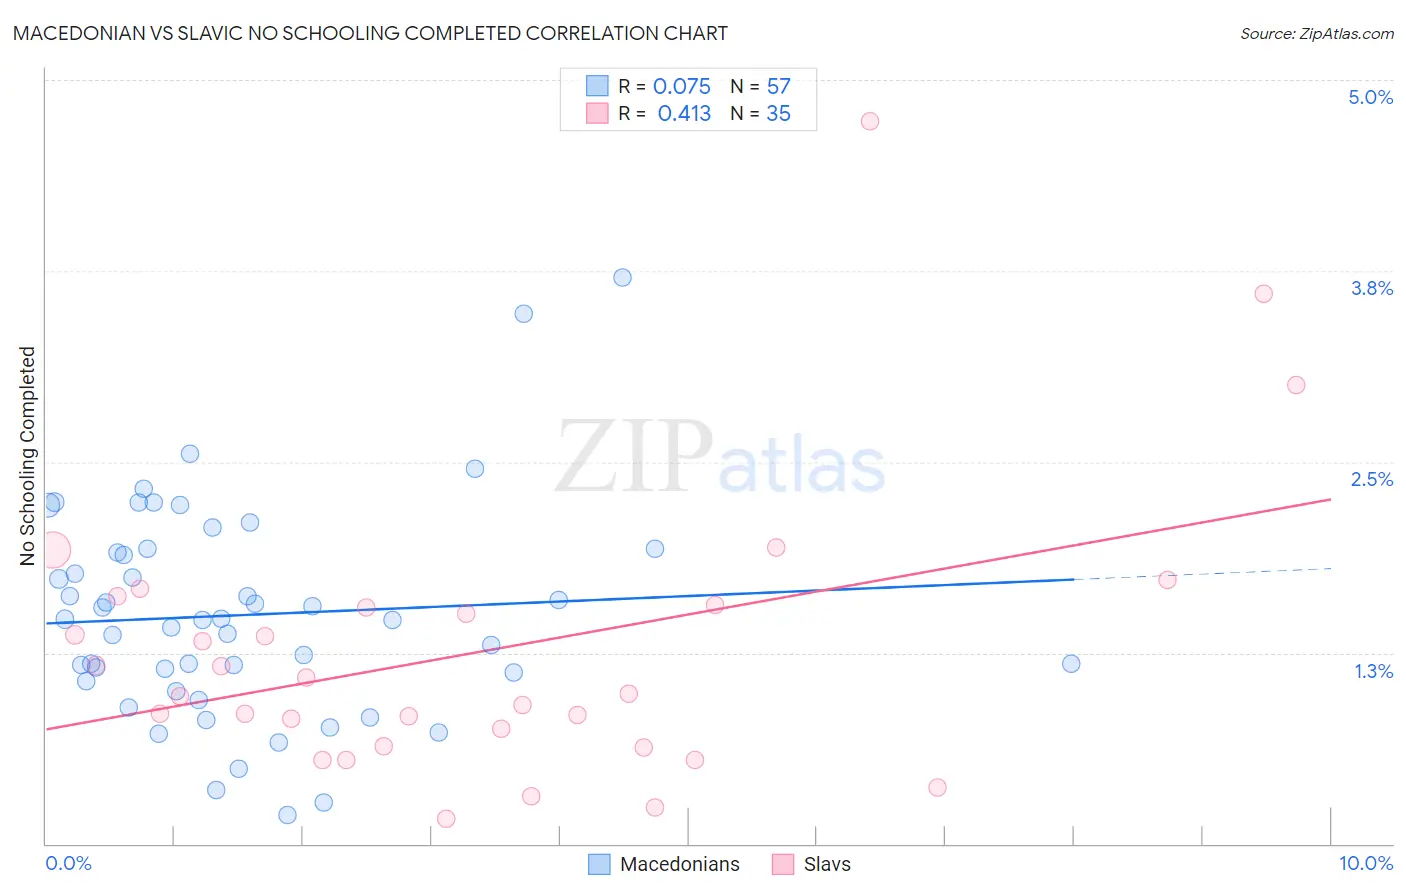
Macedonian vs Slavic No Schooling Completed Correlation Chart
The statistical analysis conducted on geographies consisting of 131,792,248 people shows a slight positive correlation between the proportion of Macedonians and percentage of population with no schooling in the United States with a correlation coefficient (R) of 0.075 and weighted average of 1.7%. Similarly, the statistical analysis conducted on geographies consisting of 268,525,041 people shows a moderate positive correlation between the proportion of Slavs and percentage of population with no schooling in the United States with a correlation coefficient (R) of 0.413 and weighted average of 1.7%, a difference of 5.7%.
No Schooling Completed Correlation Summary
| Measurement | Macedonian | Slavic |
| Minimum | 0.19% | 0.17% |
| Maximum | 3.7% | 4.7% |
| Range | 3.5% | 4.6% |
| Mean | 1.5% | 1.3% |
| Median | 1.5% | 0.98% |
| Interquartile 25% (IQ1) | 1.1% | 0.64% |
| Interquartile 75% (IQ3) | 1.9% | 1.6% |
| Interquartile Range (IQR) | 0.83% | 0.93% |
| Standard Deviation (Sample) | 0.69% | 0.94% |
| Standard Deviation (Population) | 0.69% | 0.93% |
Demographics Similar to Macedonians and Slavs by No Schooling Completed
In terms of no schooling completed, the demographic groups most similar to Macedonians are Delaware (1.7%, a difference of 0.080%), Immigrants from Sweden (1.7%, a difference of 0.12%), Cherokee (1.7%, a difference of 0.27%), Immigrants from Belgium (1.7%, a difference of 0.31%), and Zimbabwean (1.7%, a difference of 0.90%). Similarly, the demographic groups most similar to Slavs are American (1.7%, a difference of 0.12%), Tsimshian (1.7%, a difference of 0.42%), Immigrants from Northern Europe (1.7%, a difference of 1.1%), Russian (1.7%, a difference of 1.1%), and New Zealander (1.7%, a difference of 1.3%).
| Demographics | Rating | Rank | No Schooling Completed |
| Slavs | 99.8 /100 | #59 | Exceptional 1.7% |
| Americans | 99.8 /100 | #60 | Exceptional 1.7% |
| Tsimshian | 99.8 /100 | #61 | Exceptional 1.7% |
| Immigrants | Northern Europe | 99.8 /100 | #62 | Exceptional 1.7% |
| Russians | 99.8 /100 | #63 | Exceptional 1.7% |
| New Zealanders | 99.7 /100 | #64 | Exceptional 1.7% |
| Serbians | 99.7 /100 | #65 | Exceptional 1.7% |
| Canadians | 99.7 /100 | #66 | Exceptional 1.7% |
| Immigrants | Austria | 99.7 /100 | #67 | Exceptional 1.7% |
| Immigrants | Lithuania | 99.7 /100 | #68 | Exceptional 1.7% |
| Chickasaw | 99.6 /100 | #69 | Exceptional 1.7% |
| Immigrants | Netherlands | 99.6 /100 | #70 | Exceptional 1.7% |
| Immigrants | England | 99.5 /100 | #71 | Exceptional 1.7% |
| Cajuns | 99.5 /100 | #72 | Exceptional 1.7% |
| Immigrants | India | 99.4 /100 | #73 | Exceptional 1.7% |
| Zimbabweans | 99.4 /100 | #74 | Exceptional 1.7% |
| Immigrants | Belgium | 99.3 /100 | #75 | Exceptional 1.7% |
| Cherokee | 99.3 /100 | #76 | Exceptional 1.7% |
| Immigrants | Sweden | 99.3 /100 | #77 | Exceptional 1.7% |
| Delaware | 99.3 /100 | #78 | Exceptional 1.7% |
| Macedonians | 99.3 /100 | #79 | Exceptional 1.7% |