Macedonian vs Venezuelan No Schooling Completed

COMPARE

Macedonian
Race
Ancestry
AfghanAfricanAlaska NativeAlaskan AthabascanAlbanianAleutAlsatianAmericanApacheArabArapahoArgentineanArmenianAssyrian/Chaldean/SyriacAustralianAustrianBahamianBangladeshiBarbadianBasqueBelgianBelizeanBermudanBhutaneseBlackfeetBolivianBrazilianBritishBritish West IndianBulgarianBurmeseCajunCambodianCanadianCape VerdeanCarpatho RusynCelticCentral AmericanCentral American IndianCherokeeCheyenneChickasawChileanChineseChippewaChoctawColombianColvilleComancheCosta RicanCreeCreekCroatianCrowCubanCypriotCzechCzechoslovakianDanishDelawareDominicanDutchDutch West IndianEastern EuropeanEcuadorianEgyptianEnglishEstonianEthiopianEuropeanFijianFilipinoFinnishFrenchFrench American IndianFrench CanadianGermanGerman RussianGhanaianGreekGuamanian/ChamorroGuatemalanGuyaneseHaitianHmongHonduranHopiHoumaHungarianIcelanderIndian (Asian)IndonesianInupiatIranianIraqiIrishIroquoisIsraeliItalianJamaicanJapaneseJordanianKenyanKiowaKoreanLaotianLatvianLebaneseLiberianLithuanianLumbeeLuxembourgerMacedonianMalaysianMalteseMarshalleseMenomineeMexicanMexican American IndianMongolianMoroccanNative HawaiianNavajoNepaleseNew ZealanderNicaraguanNigerianNorthern EuropeanNorwegianOkinawanOsageOttawaPaiutePakistaniPalestinianPanamanianParaguayanPennsylvania GermanPeruvianPimaPolishPortuguesePotawatomiPuebloPuerto RicanPuget Sound SalishRomanianRussianSalvadoranSamoanScandinavianScotch-IrishScottishSeminoleSenegaleseSerbianShoshoneSierra LeoneanSiouxSlavicSlovakSloveneSomaliSouth AfricanSouth AmericanSouth American IndianSoviet UnionSpaniardSpanishSpanish AmericanSpanish American IndianSri LankanSubsaharan AfricanSudaneseSwedishSwissSyrianTaiwaneseThaiTlingit-HaidaTohono O'OdhamTonganTrinidadian and TobagonianTsimshianTurkishU.S. Virgin IslanderUgandanUkrainianUruguayanUteVietnameseWelshWest IndianYakamaYaquiYugoslavianYumanYup'ikZimbabwean
Immigration
NonimmigrantsImmigrantsAfghanistanAfricaAlbaniaArgentinaArmeniaAsiaAustraliaAustriaBahamasBangladeshBarbadosBelarusBelgiumBelizeBoliviaBosnia and HerzegovinaBrazilBulgariaBurma/MyanmarCabo VerdeCambodiaCameroonCanadaCaribbeanCentral AmericaChileChinaColombiaCongoCosta RicaCroatiaCubaCzechoslovakiaDenmarkDominicaDominican RepublicEastern AfricaEastern AsiaEastern EuropeEcuadorEgyptEl SalvadorEnglandEritreaEthiopiaEuropeFijiFranceGermanyGhanaGreeceGrenadaGuatemalaGuyanaHaitiHondurasHong KongHungaryIndiaIndonesiaIranIraqIrelandIsraelItalyJamaicaJapanJordanKazakhstanKenyaKoreaKuwaitLaosLatin AmericaLatviaLebanonLiberiaLithuaniaMalaysiaMexicoMicronesiaMiddle AfricaMoldovaMoroccoNepalNetherlandsNicaraguaNigeriaNorth AmericaNorth MacedoniaNorthern AfricaNorthern EuropeNorwayOceaniaPakistanPanamaPeruPhilippinesPolandPortugalRomaniaRussiaSaudi ArabiaScotlandSenegalSerbiaSierra LeoneSingaporeSomaliaSouth AfricaSouth AmericaSouth Central AsiaSouth Eastern AsiaSouthern EuropeSpainSri LankaSt. Vincent and the GrenadinesSudanSwedenSwitzerlandSyriaTaiwanThailandTrinidad and TobagoTurkeyUgandaUkraineUruguayUzbekistanVenezuelaVietnamWest IndiesWestern AfricaWestern AsiaWestern EuropeYemenZaireZimbabweAzores
Venezuelan
Race
Ancestry
AfghanAfricanAlaska NativeAlaskan AthabascanAlbanianAleutAlsatianAmericanApacheArabArapahoArgentineanArmenianAssyrian/Chaldean/SyriacAustralianAustrianBahamianBangladeshiBarbadianBasqueBelgianBelizeanBermudanBhutaneseBlackfeetBolivianBrazilianBritishBritish West IndianBulgarianBurmeseCajunCambodianCanadianCape VerdeanCarpatho RusynCelticCentral AmericanCentral American IndianCherokeeCheyenneChickasawChileanChineseChippewaChoctawColombianColvilleComancheCosta RicanCreeCreekCroatianCrowCubanCypriotCzechCzechoslovakianDanishDelawareDominicanDutchDutch West IndianEastern EuropeanEcuadorianEgyptianEnglishEstonianEthiopianEuropeanFijianFilipinoFinnishFrenchFrench American IndianFrench CanadianGermanGerman RussianGhanaianGreekGuamanian/ChamorroGuatemalanGuyaneseHaitianHmongHonduranHopiHoumaHungarianIcelanderIndian (Asian)IndonesianInupiatIranianIraqiIrishIroquoisIsraeliItalianJamaicanJapaneseJordanianKenyanKiowaKoreanLaotianLatvianLebaneseLiberianLithuanianLumbeeLuxembourgerMalaysianMalteseMarshalleseMenomineeMexicanMexican American IndianMongolianMoroccanNative HawaiianNavajoNepaleseNew ZealanderNicaraguanNigerianNorthern EuropeanNorwegianOkinawanOsageOttawaPaiutePakistaniPalestinianPanamanianParaguayanPennsylvania GermanPeruvianPimaPolishPortuguesePotawatomiPuebloPuerto RicanPuget Sound SalishRomanianRussianSalvadoranSamoanScandinavianScotch-IrishScottishSeminoleSenegaleseSerbianShoshoneSierra LeoneanSiouxSlavicSlovakSloveneSomaliSouth AfricanSouth AmericanSouth American IndianSoviet UnionSpaniardSpanishSpanish AmericanSpanish American IndianSri LankanSubsaharan AfricanSudaneseSwedishSwissSyrianTaiwaneseThaiTlingit-HaidaTohono O'OdhamTonganTrinidadian and TobagonianTsimshianTurkishU.S. Virgin IslanderUgandanUkrainianUruguayanUteVenezuelanVietnameseWelshWest IndianYakamaYaquiYugoslavianYumanYup'ikZimbabwean
Immigration
NonimmigrantsImmigrantsAfghanistanAfricaAlbaniaArgentinaArmeniaAsiaAustraliaAustriaBahamasBangladeshBarbadosBelarusBelgiumBelizeBoliviaBosnia and HerzegovinaBrazilBulgariaBurma/MyanmarCabo VerdeCambodiaCameroonCanadaCaribbeanCentral AmericaChileChinaColombiaCongoCosta RicaCroatiaCubaCzechoslovakiaDenmarkDominicaDominican RepublicEastern AfricaEastern AsiaEastern EuropeEcuadorEgyptEl SalvadorEnglandEritreaEthiopiaEuropeFijiFranceGermanyGhanaGreeceGrenadaGuatemalaGuyanaHaitiHondurasHong KongHungaryIndiaIndonesiaIranIraqIrelandIsraelItalyJamaicaJapanJordanKazakhstanKenyaKoreaKuwaitLaosLatin AmericaLatviaLebanonLiberiaLithuaniaMalaysiaMexicoMicronesiaMiddle AfricaMoldovaMoroccoNepalNetherlandsNicaraguaNigeriaNorth AmericaNorth MacedoniaNorthern AfricaNorthern EuropeNorwayOceaniaPakistanPanamaPeruPhilippinesPolandPortugalRomaniaRussiaSaudi ArabiaScotlandSenegalSerbiaSierra LeoneSingaporeSomaliaSouth AfricaSouth AmericaSouth Central AsiaSouth Eastern AsiaSouthern EuropeSpainSri LankaSt. Vincent and the GrenadinesSudanSwedenSwitzerlandSyriaTaiwanThailandTrinidad and TobagoTurkeyUgandaUkraineUruguayUzbekistanVenezuelaVietnamWest IndiesWestern AfricaWestern AsiaWestern EuropeYemenZaireZimbabweAzores
No Schooling Completed
Income
Poverty
Unemployment
Labor Participation
Family Structure
Vehicle Availability
Education Level
Disability

No Schooling Completed Comparison

Macedonians

Venezuelans

Exceptional
Excellent
1.7%
NO SCHOOLING COMPLETED
99.3/ 100
METRIC RATING
79th/ 347
METRIC RANK
2.0%
NO SCHOOLING COMPLETED
81.5/ 100
METRIC RATING
142nd/ 347
METRIC RANK

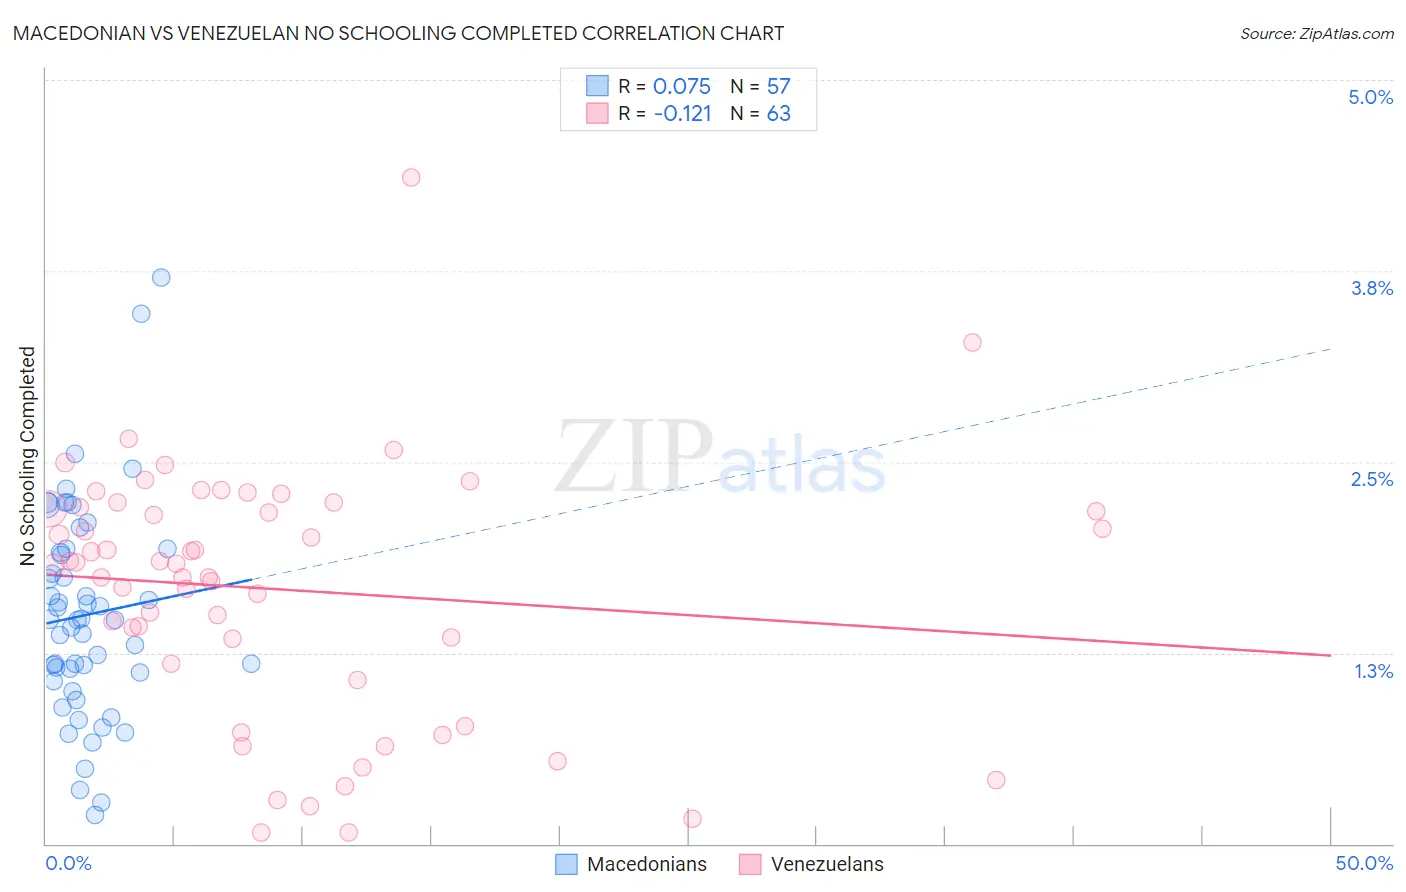
Macedonian vs Venezuelan No Schooling Completed Correlation Chart

The statistical analysis conducted on geographies consisting of 131,792,248 people shows a slight positive correlation between the proportion of Macedonians and percentage of population with no schooling in the United States with a correlation coefficient (R) of 0.075 and weighted average of 1.7%. Similarly, the statistical analysis conducted on geographies consisting of 304,404,402 people shows a poor negative correlation between the proportion of Venezuelans and percentage of population with no schooling in the United States with a correlation coefficient (R) of -0.121 and weighted average of 2.0%, a difference of 14.0%.
Macedonian vs Venezuelan No Schooling Completed

No Schooling Completed Correlation Summary

MeasurementMacedonianVenezuelan
Minimum0.19%0.072%
Maximum3.7%4.4%
Range3.5%4.3%
Mean1.5%1.7%
Median1.5%1.8%
Interquartile 25% (IQ1)1.1%1.2%
Interquartile 75% (IQ3)1.9%2.2%
Interquartile Range (IQR)0.83%1.0%
Standard Deviation (Sample)0.69%0.82%
Standard Deviation (Population)0.69%0.81%

Similar Demographics by No Schooling Completed

Demographics Similar to Macedonians by No Schooling Completed

In terms of no schooling completed, the demographic groups most similar to Macedonians are Cypriot (1.7%, a difference of 0.010%), Icelander (1.7%, a difference of 0.050%), Delaware (1.7%, a difference of 0.080%), Immigrants from Sweden (1.7%, a difference of 0.12%), and Immigrants from South Africa (1.7%, a difference of 0.14%).
DemographicsRating | RankNo Schooling Completed
Cajuns
99.5
/100
|
#72
Exceptional
1.7%
Immigrants | India
99.4
/100
|
#73
Exceptional
1.7%
Zimbabweans
99.4
/100
|
#74
Exceptional
1.7%
Immigrants | Belgium
99.3
/100
|
#75
Exceptional
1.7%
Cherokee
99.3
/100
|
#76
Exceptional
1.7%
Immigrants | Sweden
99.3
/100
|
#77
Exceptional
1.7%
Delaware
99.3
/100
|
#78
Exceptional
1.7%
Macedonians
99.3
/100
|
#79
Exceptional
1.7%
Cypriots
99.3
/100
|
#80
Exceptional
1.7%
Icelanders
99.3
/100
|
#81
Exceptional
1.7%
Immigrants | South Africa
99.3
/100
|
#82
Exceptional
1.7%
Potawatomi
99.3
/100
|
#83
Exceptional
1.7%
Immigrants | Denmark
99.2
/100
|
#84
Exceptional
1.7%
Immigrants | Australia
99.2
/100
|
#85
Exceptional
1.7%
Ukrainians
99.2
/100
|
#86
Exceptional
1.8%

Demographics Similar to Venezuelans by No Schooling Completed

In terms of no schooling completed, the demographic groups most similar to Venezuelans are Immigrants from South Central Asia (2.0%, a difference of 0.35%), Immigrants from Greece (2.0%, a difference of 0.49%), Marshallese (2.0%, a difference of 0.50%), Alsatian (2.0%, a difference of 0.55%), and Immigrants from Iran (2.0%, a difference of 0.55%).
DemographicsRating | RankNo Schooling Completed
Hmong
88.5
/100
|
#135
Excellent
1.9%
Burmese
88.2
/100
|
#136
Excellent
1.9%
Filipinos
85.5
/100
|
#137
Excellent
2.0%
Immigrants | Israel
85.4
/100
|
#138
Excellent
2.0%
Jordanians
84.5
/100
|
#139
Excellent
2.0%
Marshallese
83.5
/100
|
#140
Excellent
2.0%
Immigrants | Greece
83.5
/100
|
#141
Excellent
2.0%
Venezuelans
81.5
/100
|
#142
Excellent
2.0%
Immigrants | South Central Asia
80.0
/100
|
#143
Good
2.0%
Alsatians
79.1
/100
|
#144
Good
2.0%
Immigrants | Iran
79.0
/100
|
#145
Good
2.0%
Immigrants | Moldova
78.0
/100
|
#146
Good
2.0%
Soviet Union
77.1
/100
|
#147
Good
2.0%
Shoshone
76.7
/100
|
#148
Good
2.0%
Immigrants | North Macedonia
75.9
/100
|
#149
Good
2.0%