Immigrants from Somalia vs Slavic No Schooling Completed
COMPARE
Immigrants from Somalia
Slavic
No Schooling Completed
No Schooling Completed Comparison
Immigrants from Somalia
Slavs
3.0%
NO SCHOOLING COMPLETED
0.0/ 100
METRIC RATING
308th/ 347
METRIC RANK
1.7%
NO SCHOOLING COMPLETED
99.8/ 100
METRIC RATING
59th/ 347
METRIC RANK
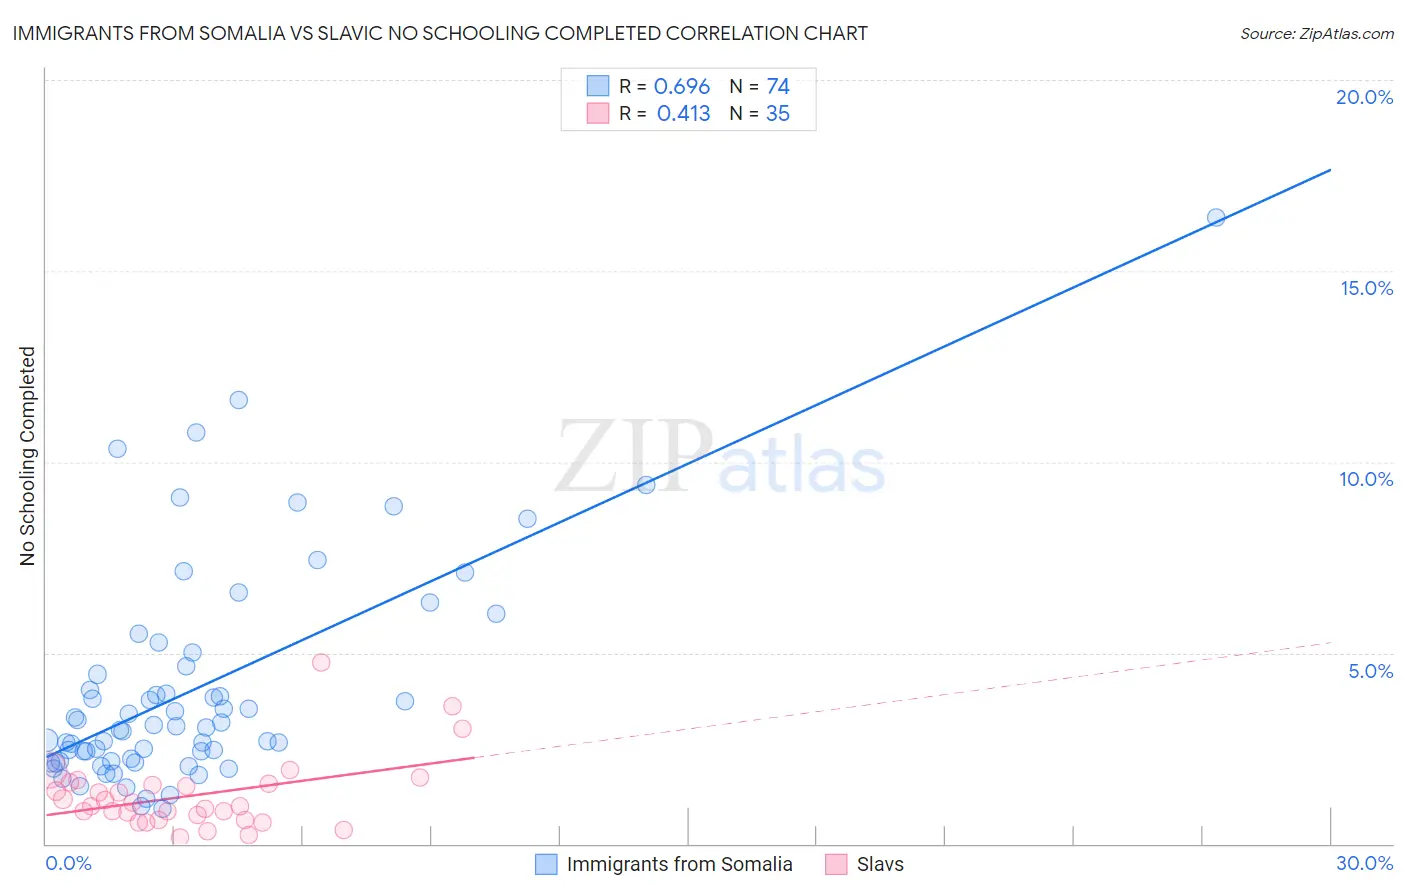
Immigrants from Somalia vs Slavic No Schooling Completed Correlation Chart
The statistical analysis conducted on geographies consisting of 92,035,757 people shows a significant positive correlation between the proportion of Immigrants from Somalia and percentage of population with no schooling in the United States with a correlation coefficient (R) of 0.696 and weighted average of 3.0%. Similarly, the statistical analysis conducted on geographies consisting of 268,525,041 people shows a moderate positive correlation between the proportion of Slavs and percentage of population with no schooling in the United States with a correlation coefficient (R) of 0.413 and weighted average of 1.7%, a difference of 82.5%.
No Schooling Completed Correlation Summary
| Measurement | Immigrants from Somalia | Slavic |
| Minimum | 0.92% | 0.17% |
| Maximum | 16.4% | 4.7% |
| Range | 15.5% | 4.6% |
| Mean | 4.1% | 1.3% |
| Median | 3.0% | 0.98% |
| Interquartile 25% (IQ1) | 2.2% | 0.64% |
| Interquartile 75% (IQ3) | 4.6% | 1.6% |
| Interquartile Range (IQR) | 2.5% | 0.93% |
| Standard Deviation (Sample) | 2.9% | 0.94% |
| Standard Deviation (Population) | 2.9% | 0.93% |
Similar Demographics by No Schooling Completed
Demographics Similar to Immigrants from Somalia by No Schooling Completed
In terms of no schooling completed, the demographic groups most similar to Immigrants from Somalia are Immigrants from Haiti (3.0%, a difference of 0.16%), Belizean (3.0%, a difference of 0.24%), Hispanic or Latino (3.0%, a difference of 0.81%), Guyanese (3.0%, a difference of 0.86%), and Immigrants from the Azores (3.0%, a difference of 0.96%).
| Demographics | Rating | Rank | No Schooling Completed |
| Immigrants | South Eastern Asia | 0.0 /100 | #301 | Tragic 2.9% |
| Immigrants | Caribbean | 0.0 /100 | #302 | Tragic 2.9% |
| Somalis | 0.0 /100 | #303 | Tragic 2.9% |
| Nicaraguans | 0.0 /100 | #304 | Tragic 2.9% |
| Ecuadorians | 0.0 /100 | #305 | Tragic 3.0% |
| Belizeans | 0.0 /100 | #306 | Tragic 3.0% |
| Immigrants | Haiti | 0.0 /100 | #307 | Tragic 3.0% |
| Immigrants | Somalia | 0.0 /100 | #308 | Tragic 3.0% |
| Hispanics or Latinos | 0.0 /100 | #309 | Tragic 3.0% |
| Guyanese | 0.0 /100 | #310 | Tragic 3.0% |
| Immigrants | Azores | 0.0 /100 | #311 | Tragic 3.0% |
| Sri Lankans | 0.0 /100 | #312 | Tragic 3.0% |
| Hondurans | 0.0 /100 | #313 | Tragic 3.1% |
| Immigrants | Belize | 0.0 /100 | #314 | Tragic 3.1% |
| Immigrants | Nicaragua | 0.0 /100 | #315 | Tragic 3.1% |
Demographics Similar to Slavs by No Schooling Completed
In terms of no schooling completed, the demographic groups most similar to Slavs are Kiowa (1.6%, a difference of 0.070%), American (1.7%, a difference of 0.12%), Austrian (1.6%, a difference of 0.23%), Tsimshian (1.7%, a difference of 0.42%), and Greek (1.6%, a difference of 0.54%).
| Demographics | Rating | Rank | No Schooling Completed |
| Immigrants | Canada | 99.8 /100 | #52 | Exceptional 1.6% |
| Creek | 99.8 /100 | #53 | Exceptional 1.6% |
| Crow | 99.8 /100 | #54 | Exceptional 1.6% |
| Greeks | 99.8 /100 | #55 | Exceptional 1.6% |
| Immigrants | North America | 99.8 /100 | #56 | Exceptional 1.6% |
| Austrians | 99.8 /100 | #57 | Exceptional 1.6% |
| Kiowa | 99.8 /100 | #58 | Exceptional 1.6% |
| Slavs | 99.8 /100 | #59 | Exceptional 1.7% |
| Americans | 99.8 /100 | #60 | Exceptional 1.7% |
| Tsimshian | 99.8 /100 | #61 | Exceptional 1.7% |
| Immigrants | Northern Europe | 99.8 /100 | #62 | Exceptional 1.7% |
| Russians | 99.8 /100 | #63 | Exceptional 1.7% |
| New Zealanders | 99.7 /100 | #64 | Exceptional 1.7% |
| Serbians | 99.7 /100 | #65 | Exceptional 1.7% |
| Canadians | 99.7 /100 | #66 | Exceptional 1.7% |