British vs Slavic No Schooling Completed
COMPARE
British
Slavic
No Schooling Completed
No Schooling Completed Comparison
British
Slavs
1.5%
NO SCHOOLING COMPLETED
100.0/ 100
METRIC RATING
30th/ 347
METRIC RANK
1.7%
NO SCHOOLING COMPLETED
99.8/ 100
METRIC RATING
59th/ 347
METRIC RANK
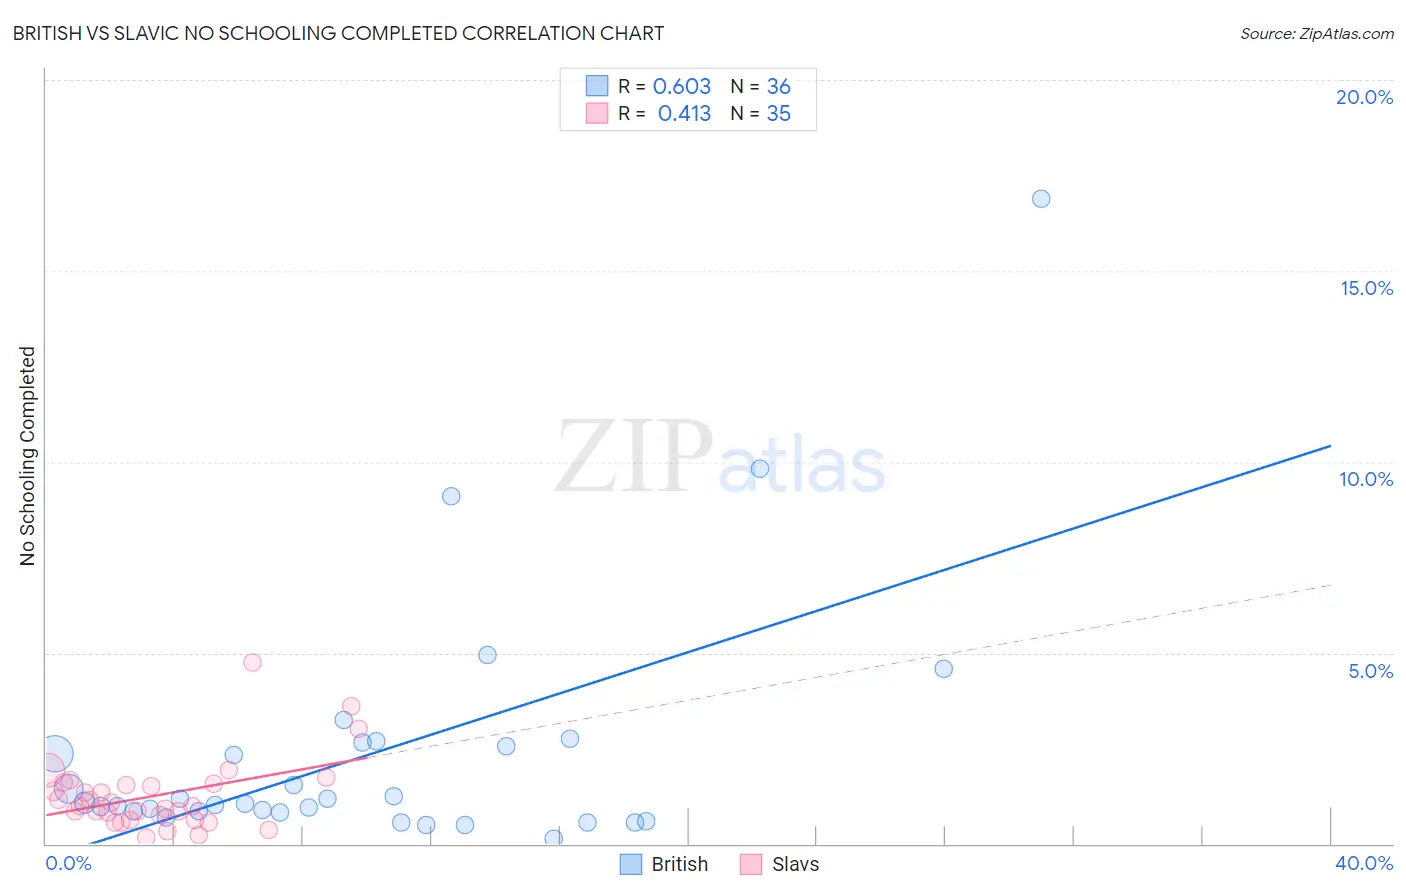
British vs Slavic No Schooling Completed Correlation Chart
The statistical analysis conducted on geographies consisting of 518,649,413 people shows a significant positive correlation between the proportion of British and percentage of population with no schooling in the United States with a correlation coefficient (R) of 0.603 and weighted average of 1.5%. Similarly, the statistical analysis conducted on geographies consisting of 268,525,041 people shows a moderate positive correlation between the proportion of Slavs and percentage of population with no schooling in the United States with a correlation coefficient (R) of 0.413 and weighted average of 1.7%, a difference of 8.5%.
No Schooling Completed Correlation Summary
| Measurement | British | Slavic |
| Minimum | 0.14% | 0.17% |
| Maximum | 16.9% | 4.7% |
| Range | 16.8% | 4.6% |
| Mean | 2.4% | 1.3% |
| Median | 1.1% | 0.98% |
| Interquartile 25% (IQ1) | 0.83% | 0.64% |
| Interquartile 75% (IQ3) | 2.6% | 1.6% |
| Interquartile Range (IQR) | 1.8% | 0.93% |
| Standard Deviation (Sample) | 3.3% | 0.94% |
| Standard Deviation (Population) | 3.3% | 0.93% |
Similar Demographics by No Schooling Completed
Demographics Similar to British by No Schooling Completed
In terms of no schooling completed, the demographic groups most similar to British are Inupiat (1.5%, a difference of 0.030%), Swiss (1.5%, a difference of 0.42%), Lumbee (1.5%, a difference of 0.48%), Italian (1.5%, a difference of 1.1%), and Latvian (1.5%, a difference of 1.4%).
| Demographics | Rating | Rank | No Schooling Completed |
| Europeans | 100.0 /100 | #23 | Exceptional 1.5% |
| Pennsylvania Germans | 100.0 /100 | #24 | Exceptional 1.5% |
| French | 100.0 /100 | #25 | Exceptional 1.5% |
| Czechs | 100.0 /100 | #26 | Exceptional 1.5% |
| Scandinavians | 100.0 /100 | #27 | Exceptional 1.5% |
| French Canadians | 100.0 /100 | #28 | Exceptional 1.5% |
| Lumbee | 100.0 /100 | #29 | Exceptional 1.5% |
| British | 100.0 /100 | #30 | Exceptional 1.5% |
| Inupiat | 100.0 /100 | #31 | Exceptional 1.5% |
| Swiss | 100.0 /100 | #32 | Exceptional 1.5% |
| Italians | 100.0 /100 | #33 | Exceptional 1.5% |
| Latvians | 100.0 /100 | #34 | Exceptional 1.5% |
| Eastern Europeans | 100.0 /100 | #35 | Exceptional 1.6% |
| Aleuts | 99.9 /100 | #36 | Exceptional 1.6% |
| Belgians | 99.9 /100 | #37 | Exceptional 1.6% |
Demographics Similar to Slavs by No Schooling Completed
In terms of no schooling completed, the demographic groups most similar to Slavs are Kiowa (1.6%, a difference of 0.070%), American (1.7%, a difference of 0.12%), Austrian (1.6%, a difference of 0.23%), Tsimshian (1.7%, a difference of 0.42%), and Greek (1.6%, a difference of 0.54%).
| Demographics | Rating | Rank | No Schooling Completed |
| Immigrants | Canada | 99.8 /100 | #52 | Exceptional 1.6% |
| Creek | 99.8 /100 | #53 | Exceptional 1.6% |
| Crow | 99.8 /100 | #54 | Exceptional 1.6% |
| Greeks | 99.8 /100 | #55 | Exceptional 1.6% |
| Immigrants | North America | 99.8 /100 | #56 | Exceptional 1.6% |
| Austrians | 99.8 /100 | #57 | Exceptional 1.6% |
| Kiowa | 99.8 /100 | #58 | Exceptional 1.6% |
| Slavs | 99.8 /100 | #59 | Exceptional 1.7% |
| Americans | 99.8 /100 | #60 | Exceptional 1.7% |
| Tsimshian | 99.8 /100 | #61 | Exceptional 1.7% |
| Immigrants | Northern Europe | 99.8 /100 | #62 | Exceptional 1.7% |
| Russians | 99.8 /100 | #63 | Exceptional 1.7% |
| New Zealanders | 99.7 /100 | #64 | Exceptional 1.7% |
| Serbians | 99.7 /100 | #65 | Exceptional 1.7% |
| Canadians | 99.7 /100 | #66 | Exceptional 1.7% |