Macedonian vs Slavic Unemployment Among Ages 30 to 34 years
COMPARE
Macedonian
Slavic
Unemployment Among Ages 30 to 34 years
Unemployment Among Ages 30 to 34 years Comparison
Macedonians
Slavs
5.5%
UNEMPLOYMENT AMONG AGES 30 TO 34 YEARS
47.1/ 100
METRIC RATING
178th/ 347
METRIC RANK
5.5%
UNEMPLOYMENT AMONG AGES 30 TO 34 YEARS
30.9/ 100
METRIC RATING
194th/ 347
METRIC RANK
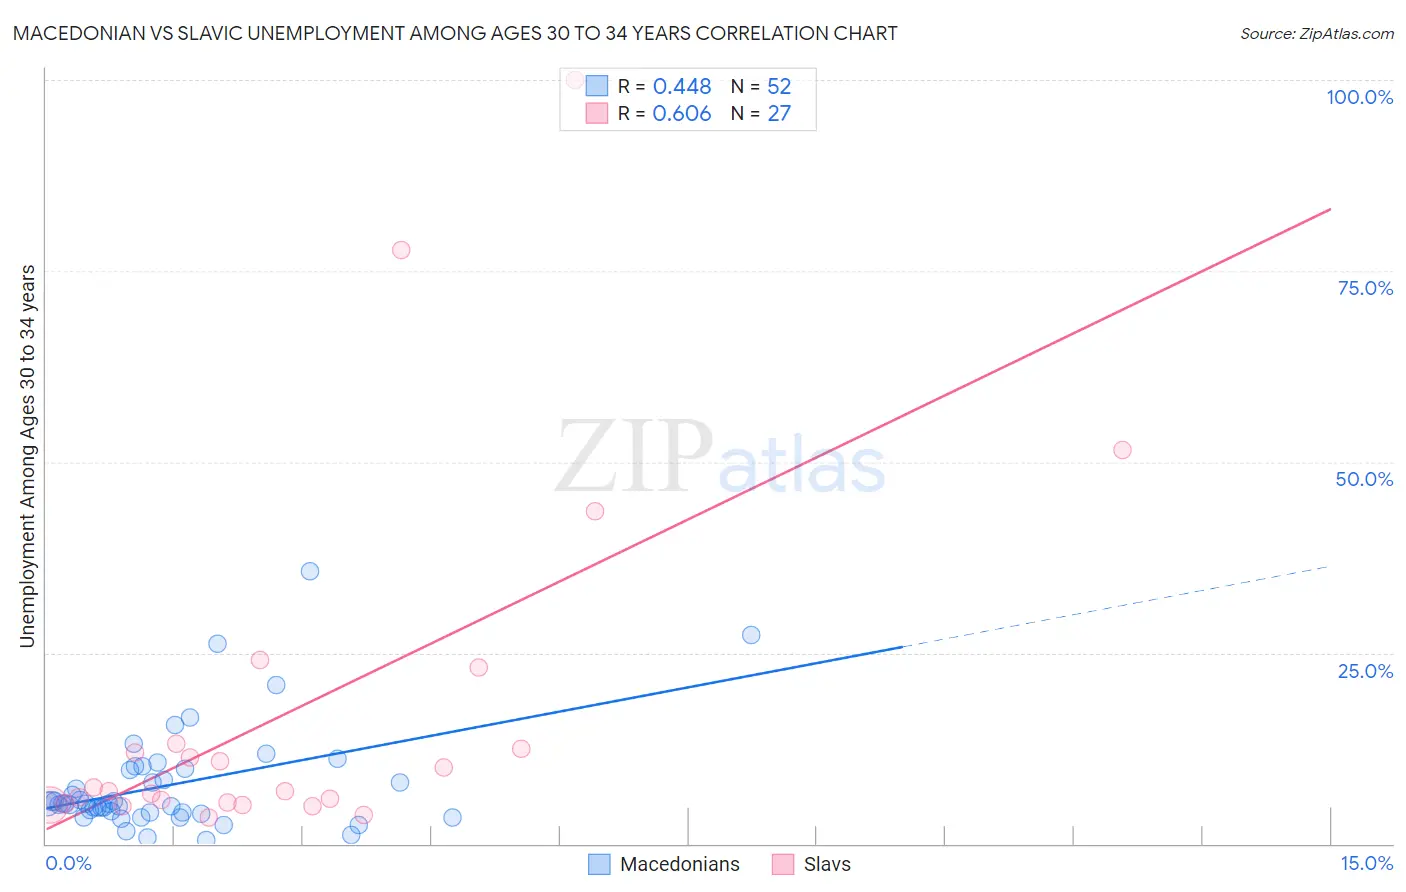
Macedonian vs Slavic Unemployment Among Ages 30 to 34 years Correlation Chart
The statistical analysis conducted on geographies consisting of 128,261,818 people shows a moderate positive correlation between the proportion of Macedonians and unemployment rate among population between the ages 30 and 34 in the United States with a correlation coefficient (R) of 0.448 and weighted average of 5.5%. Similarly, the statistical analysis conducted on geographies consisting of 257,801,563 people shows a significant positive correlation between the proportion of Slavs and unemployment rate among population between the ages 30 and 34 in the United States with a correlation coefficient (R) of 0.606 and weighted average of 5.5%, a difference of 1.2%.
Unemployment Among Ages 30 to 34 years Correlation Summary
| Measurement | Macedonian | Slavic |
| Minimum | 0.50% | 3.5% |
| Maximum | 35.7% | 100.0% |
| Range | 35.2% | 96.5% |
| Mean | 7.7% | 17.5% |
| Median | 5.2% | 6.9% |
| Interquartile 25% (IQ1) | 4.1% | 5.3% |
| Interquartile 75% (IQ3) | 9.8% | 13.0% |
| Interquartile Range (IQR) | 5.7% | 7.7% |
| Standard Deviation (Sample) | 6.9% | 23.8% |
| Standard Deviation (Population) | 6.8% | 23.4% |
Demographics Similar to Macedonians and Slavs by Unemployment Among Ages 30 to 34 years
In terms of unemployment among ages 30 to 34 years, the demographic groups most similar to Macedonians are Costa Rican (5.5%, a difference of 0.020%), Immigrants from Ukraine (5.5%, a difference of 0.050%), Immigrants from Peru (5.5%, a difference of 0.070%), Italian (5.5%, a difference of 0.11%), and Immigrants from Lebanon (5.5%, a difference of 0.25%). Similarly, the demographic groups most similar to Slavs are Finnish (5.5%, a difference of 0.010%), Immigrants from Africa (5.5%, a difference of 0.020%), Irish (5.5%, a difference of 0.030%), Moroccan (5.5%, a difference of 0.030%), and Immigrants from South America (5.5%, a difference of 0.090%).
| Demographics | Rating | Rank | Unemployment Among Ages 30 to 34 years |
| Immigrants | Peru | 48.0 /100 | #176 | Average 5.5% |
| Immigrants | Ukraine | 47.7 /100 | #177 | Average 5.5% |
| Macedonians | 47.1 /100 | #178 | Average 5.5% |
| Costa Ricans | 46.7 /100 | #179 | Average 5.5% |
| Italians | 45.5 /100 | #180 | Average 5.5% |
| Immigrants | Lebanon | 43.5 /100 | #181 | Average 5.5% |
| Immigrants | Denmark | 43.4 /100 | #182 | Average 5.5% |
| Hungarians | 43.1 /100 | #183 | Average 5.5% |
| Malaysians | 41.8 /100 | #184 | Average 5.5% |
| Immigrants | Western Europe | 39.1 /100 | #185 | Fair 5.5% |
| Canadians | 38.2 /100 | #186 | Fair 5.5% |
| Immigrants | Western Asia | 38.2 /100 | #187 | Fair 5.5% |
| Immigrants | Norway | 36.1 /100 | #188 | Fair 5.5% |
| Immigrants | England | 35.7 /100 | #189 | Fair 5.5% |
| Immigrants | Kazakhstan | 33.9 /100 | #190 | Fair 5.5% |
| Irish | 31.3 /100 | #191 | Fair 5.5% |
| Moroccans | 31.2 /100 | #192 | Fair 5.5% |
| Immigrants | Africa | 31.0 /100 | #193 | Fair 5.5% |
| Slavs | 30.9 /100 | #194 | Fair 5.5% |
| Finns | 30.7 /100 | #195 | Fair 5.5% |
| Immigrants | South America | 29.8 /100 | #196 | Fair 5.5% |