Bhutanese vs Slavic No Schooling Completed
COMPARE
Bhutanese
Slavic
No Schooling Completed
No Schooling Completed Comparison
Bhutanese
Slavs
1.8%
NO SCHOOLING COMPLETED
98.4/ 100
METRIC RATING
96th/ 347
METRIC RANK
1.7%
NO SCHOOLING COMPLETED
99.8/ 100
METRIC RATING
59th/ 347
METRIC RANK
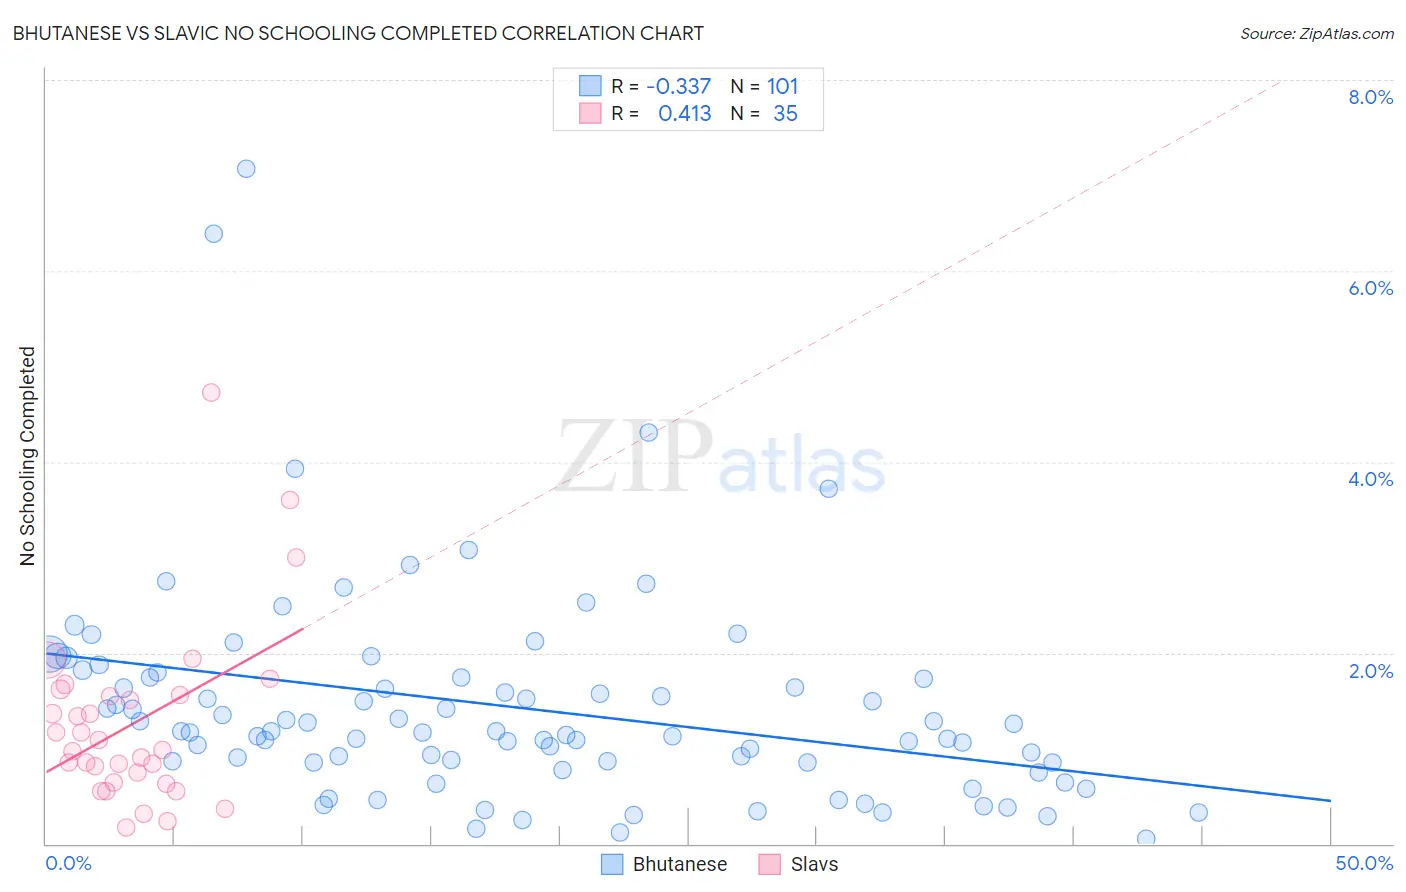
Bhutanese vs Slavic No Schooling Completed Correlation Chart
The statistical analysis conducted on geographies consisting of 448,858,455 people shows a mild negative correlation between the proportion of Bhutanese and percentage of population with no schooling in the United States with a correlation coefficient (R) of -0.337 and weighted average of 1.8%. Similarly, the statistical analysis conducted on geographies consisting of 268,525,041 people shows a moderate positive correlation between the proportion of Slavs and percentage of population with no schooling in the United States with a correlation coefficient (R) of 0.413 and weighted average of 1.7%, a difference of 9.1%.
No Schooling Completed Correlation Summary
| Measurement | Bhutanese | Slavic |
| Minimum | 0.048% | 0.17% |
| Maximum | 7.1% | 4.7% |
| Range | 7.0% | 4.6% |
| Mean | 1.4% | 1.3% |
| Median | 1.2% | 0.98% |
| Interquartile 25% (IQ1) | 0.85% | 0.64% |
| Interquartile 75% (IQ3) | 1.7% | 1.6% |
| Interquartile Range (IQR) | 0.89% | 0.93% |
| Standard Deviation (Sample) | 1.1% | 0.94% |
| Standard Deviation (Population) | 1.1% | 0.93% |
Similar Demographics by No Schooling Completed
Demographics Similar to Bhutanese by No Schooling Completed
In terms of no schooling completed, the demographic groups most similar to Bhutanese are Immigrants from Ireland (1.8%, a difference of 0.18%), Puget Sound Salish (1.8%, a difference of 0.23%), Nonimmigrants (1.8%, a difference of 0.24%), Iranian (1.8%, a difference of 0.46%), and Choctaw (1.8%, a difference of 0.65%).
| Demographics | Rating | Rank | No Schooling Completed |
| South Africans | 99.1 /100 | #89 | Exceptional 1.8% |
| Sioux | 99.0 /100 | #90 | Exceptional 1.8% |
| Immigrants | Germany | 99.0 /100 | #91 | Exceptional 1.8% |
| Romanians | 98.8 /100 | #92 | Exceptional 1.8% |
| Turks | 98.7 /100 | #93 | Exceptional 1.8% |
| Immigrants | Nonimmigrants | 98.5 /100 | #94 | Exceptional 1.8% |
| Puget Sound Salish | 98.5 /100 | #95 | Exceptional 1.8% |
| Bhutanese | 98.4 /100 | #96 | Exceptional 1.8% |
| Immigrants | Ireland | 98.4 /100 | #97 | Exceptional 1.8% |
| Iranians | 98.2 /100 | #98 | Exceptional 1.8% |
| Choctaw | 98.1 /100 | #99 | Exceptional 1.8% |
| Immigrants | Singapore | 98.0 /100 | #100 | Exceptional 1.8% |
| Immigrants | Czechoslovakia | 97.9 /100 | #101 | Exceptional 1.8% |
| Immigrants | Switzerland | 97.9 /100 | #102 | Exceptional 1.8% |
| Basques | 97.9 /100 | #103 | Exceptional 1.8% |
Demographics Similar to Slavs by No Schooling Completed
In terms of no schooling completed, the demographic groups most similar to Slavs are Kiowa (1.6%, a difference of 0.070%), American (1.7%, a difference of 0.12%), Austrian (1.6%, a difference of 0.23%), Tsimshian (1.7%, a difference of 0.42%), and Greek (1.6%, a difference of 0.54%).
| Demographics | Rating | Rank | No Schooling Completed |
| Immigrants | Canada | 99.8 /100 | #52 | Exceptional 1.6% |
| Creek | 99.8 /100 | #53 | Exceptional 1.6% |
| Crow | 99.8 /100 | #54 | Exceptional 1.6% |
| Greeks | 99.8 /100 | #55 | Exceptional 1.6% |
| Immigrants | North America | 99.8 /100 | #56 | Exceptional 1.6% |
| Austrians | 99.8 /100 | #57 | Exceptional 1.6% |
| Kiowa | 99.8 /100 | #58 | Exceptional 1.6% |
| Slavs | 99.8 /100 | #59 | Exceptional 1.7% |
| Americans | 99.8 /100 | #60 | Exceptional 1.7% |
| Tsimshian | 99.8 /100 | #61 | Exceptional 1.7% |
| Immigrants | Northern Europe | 99.8 /100 | #62 | Exceptional 1.7% |
| Russians | 99.8 /100 | #63 | Exceptional 1.7% |
| New Zealanders | 99.7 /100 | #64 | Exceptional 1.7% |
| Serbians | 99.7 /100 | #65 | Exceptional 1.7% |
| Canadians | 99.7 /100 | #66 | Exceptional 1.7% |