Macedonian vs Immigrants from Colombia No Schooling Completed
COMPARE
Macedonian
Immigrants from Colombia
No Schooling Completed
No Schooling Completed Comparison
Macedonians
Immigrants from Colombia
1.7%
NO SCHOOLING COMPLETED
99.3/ 100
METRIC RATING
79th/ 347
METRIC RANK
2.4%
NO SCHOOLING COMPLETED
1.0/ 100
METRIC RATING
252nd/ 347
METRIC RANK
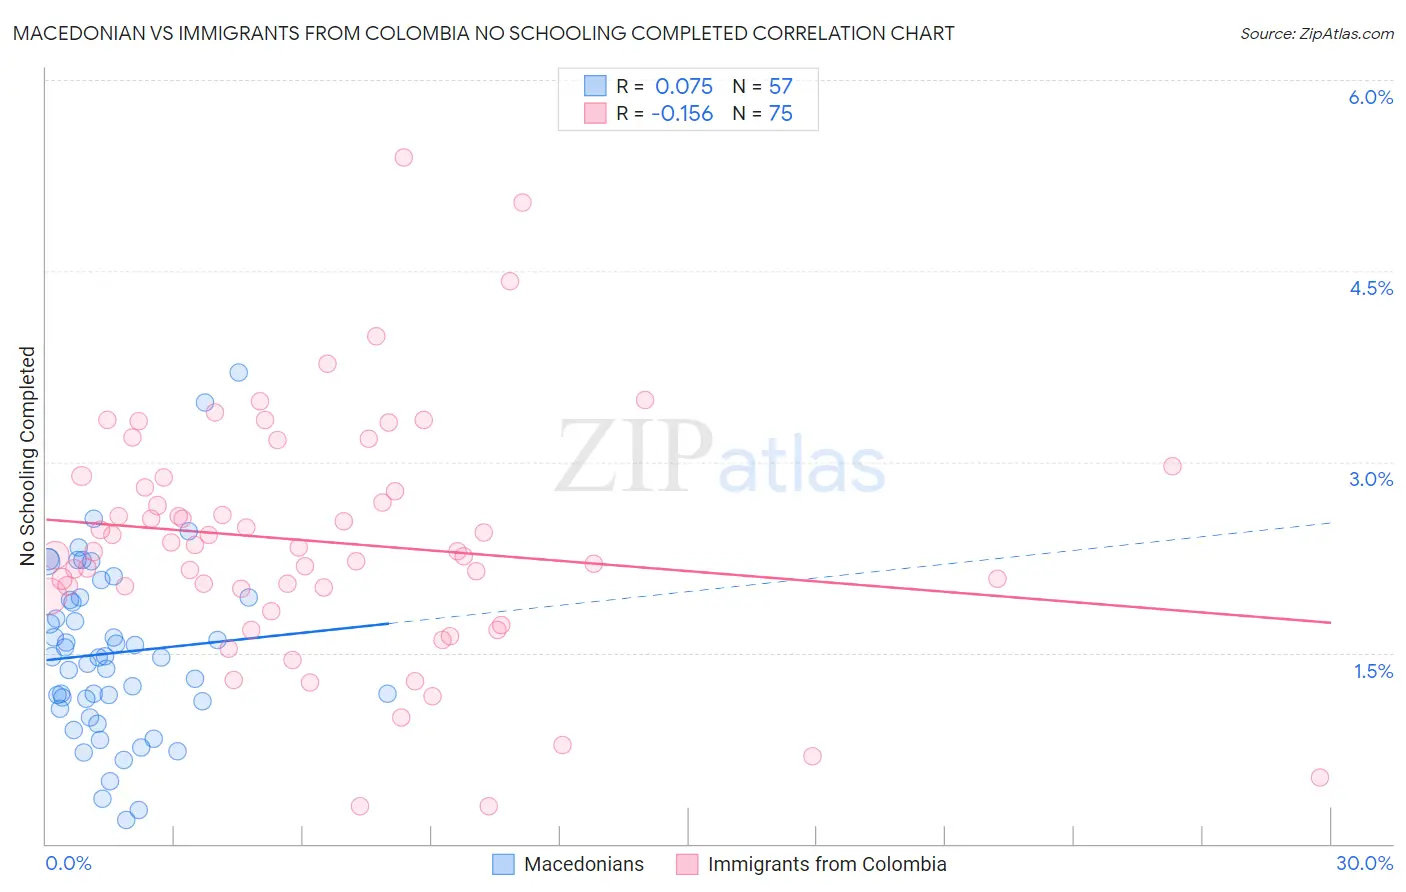
Macedonian vs Immigrants from Colombia No Schooling Completed Correlation Chart
The statistical analysis conducted on geographies consisting of 131,792,248 people shows a slight positive correlation between the proportion of Macedonians and percentage of population with no schooling in the United States with a correlation coefficient (R) of 0.075 and weighted average of 1.7%. Similarly, the statistical analysis conducted on geographies consisting of 375,786,629 people shows a poor negative correlation between the proportion of Immigrants from Colombia and percentage of population with no schooling in the United States with a correlation coefficient (R) of -0.156 and weighted average of 2.4%, a difference of 38.5%.
No Schooling Completed Correlation Summary
| Measurement | Macedonian | Immigrants from Colombia |
| Minimum | 0.19% | 0.30% |
| Maximum | 3.7% | 5.4% |
| Range | 3.5% | 5.1% |
| Mean | 1.5% | 2.4% |
| Median | 1.5% | 2.3% |
| Interquartile 25% (IQ1) | 1.1% | 1.9% |
| Interquartile 75% (IQ3) | 1.9% | 2.9% |
| Interquartile Range (IQR) | 0.83% | 0.94% |
| Standard Deviation (Sample) | 0.69% | 0.95% |
| Standard Deviation (Population) | 0.69% | 0.94% |
Similar Demographics by No Schooling Completed
Demographics Similar to Macedonians by No Schooling Completed
In terms of no schooling completed, the demographic groups most similar to Macedonians are Cypriot (1.7%, a difference of 0.010%), Icelander (1.7%, a difference of 0.050%), Delaware (1.7%, a difference of 0.080%), Immigrants from Sweden (1.7%, a difference of 0.12%), and Immigrants from South Africa (1.7%, a difference of 0.14%).
| Demographics | Rating | Rank | No Schooling Completed |
| Cajuns | 99.5 /100 | #72 | Exceptional 1.7% |
| Immigrants | India | 99.4 /100 | #73 | Exceptional 1.7% |
| Zimbabweans | 99.4 /100 | #74 | Exceptional 1.7% |
| Immigrants | Belgium | 99.3 /100 | #75 | Exceptional 1.7% |
| Cherokee | 99.3 /100 | #76 | Exceptional 1.7% |
| Immigrants | Sweden | 99.3 /100 | #77 | Exceptional 1.7% |
| Delaware | 99.3 /100 | #78 | Exceptional 1.7% |
| Macedonians | 99.3 /100 | #79 | Exceptional 1.7% |
| Cypriots | 99.3 /100 | #80 | Exceptional 1.7% |
| Icelanders | 99.3 /100 | #81 | Exceptional 1.7% |
| Immigrants | South Africa | 99.3 /100 | #82 | Exceptional 1.7% |
| Potawatomi | 99.3 /100 | #83 | Exceptional 1.7% |
| Immigrants | Denmark | 99.2 /100 | #84 | Exceptional 1.7% |
| Immigrants | Australia | 99.2 /100 | #85 | Exceptional 1.7% |
| Ukrainians | 99.2 /100 | #86 | Exceptional 1.8% |
Demographics Similar to Immigrants from Colombia by No Schooling Completed
In terms of no schooling completed, the demographic groups most similar to Immigrants from Colombia are Immigrants from Asia (2.4%, a difference of 0.13%), Immigrants from Eastern Africa (2.4%, a difference of 0.25%), Immigrants from Africa (2.4%, a difference of 0.45%), Ethiopian (2.4%, a difference of 0.45%), and Immigrants from Middle Africa (2.4%, a difference of 0.46%).
| Demographics | Rating | Rank | No Schooling Completed |
| Bolivians | 1.4 /100 | #245 | Tragic 2.4% |
| Immigrants | Congo | 1.4 /100 | #246 | Tragic 2.4% |
| Immigrants | Iraq | 1.3 /100 | #247 | Tragic 2.4% |
| Asians | 1.2 /100 | #248 | Tragic 2.4% |
| Jamaicans | 1.2 /100 | #249 | Tragic 2.4% |
| Immigrants | Middle Africa | 1.1 /100 | #250 | Tragic 2.4% |
| Immigrants | Africa | 1.1 /100 | #251 | Tragic 2.4% |
| Immigrants | Colombia | 1.0 /100 | #252 | Tragic 2.4% |
| Immigrants | Asia | 0.9 /100 | #253 | Tragic 2.4% |
| Immigrants | Eastern Africa | 0.9 /100 | #254 | Tragic 2.4% |
| Ethiopians | 0.8 /100 | #255 | Tragic 2.4% |
| Yaqui | 0.8 /100 | #256 | Tragic 2.4% |
| Immigrants | South America | 0.6 /100 | #257 | Tragic 2.5% |
| Assyrians/Chaldeans/Syriacs | 0.6 /100 | #258 | Tragic 2.5% |
| Immigrants | Jamaica | 0.6 /100 | #259 | Tragic 2.5% |