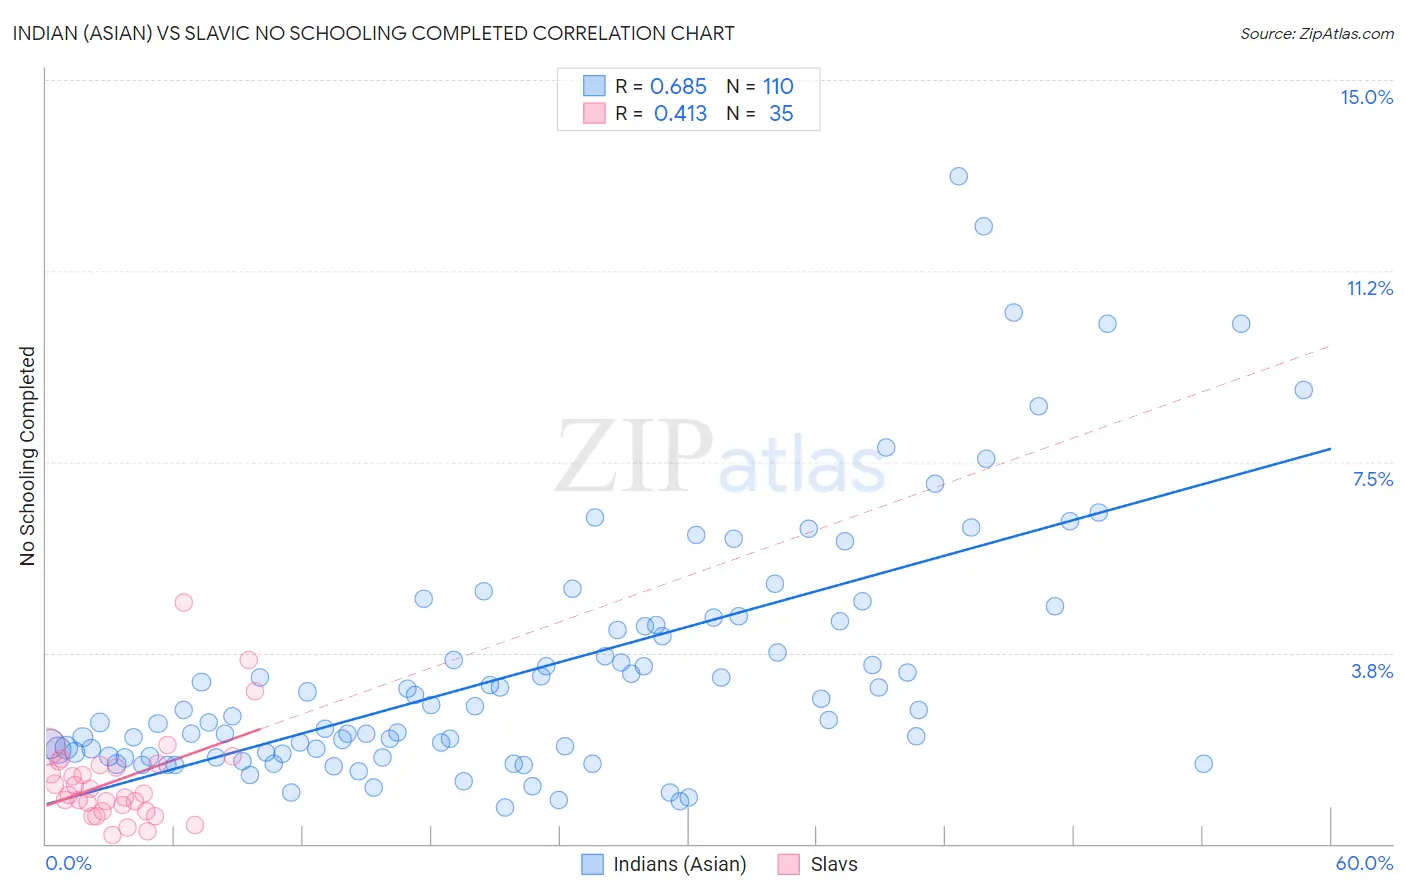
Indian (Asian) vs Slavic No Schooling Completed
COMPARE
Indian (Asian)
Slavic
No Schooling Completed
No Schooling Completed Comparison
Indians (Asian)
Slavs
2.5%
NO SCHOOLING COMPLETED
0.4/ 100
METRIC RATING
264th/ 347
METRIC RANK
1.7%
NO SCHOOLING COMPLETED
99.8/ 100
METRIC RATING
59th/ 347
METRIC RANK
Indian (Asian) vs Slavic No Schooling Completed Correlation Chart
The statistical analysis conducted on geographies consisting of 487,020,053 people shows a significant positive correlation between the proportion of Indians (Asian) and percentage of population with no schooling in the United States with a correlation coefficient (R) of 0.685 and weighted average of 2.5%. Similarly, the statistical analysis conducted on geographies consisting of 268,525,041 people shows a moderate positive correlation between the proportion of Slavs and percentage of population with no schooling in the United States with a correlation coefficient (R) of 0.413 and weighted average of 1.7%, a difference of 49.9%.
No Schooling Completed Correlation Summary
| Measurement | Indian (Asian) | Slavic |
| Minimum | 0.70% | 0.17% |
| Maximum | 13.1% | 4.7% |
| Range | 12.4% | 4.6% |
| Mean | 3.4% | 1.3% |
| Median | 2.6% | 0.98% |
| Interquartile 25% (IQ1) | 1.8% | 0.64% |
| Interquartile 75% (IQ3) | 4.3% | 1.6% |
| Interquartile Range (IQR) | 2.5% | 0.93% |
| Standard Deviation (Sample) | 2.5% | 0.94% |
| Standard Deviation (Population) | 2.5% | 0.93% |
Similar Demographics by No Schooling Completed
Demographics Similar to Indians (Asian) by No Schooling Completed
In terms of no schooling completed, the demographic groups most similar to Indians (Asian) are Immigrants from Liberia (2.5%, a difference of 0.13%), West Indian (2.5%, a difference of 0.18%), Fijian (2.5%, a difference of 0.26%), Immigrants from Sierra Leone (2.5%, a difference of 0.30%), and Yuman (2.5%, a difference of 0.43%).
| Demographics | Rating | Rank | No Schooling Completed |
| Immigrants | South America | 0.6 /100 | #257 | Tragic 2.5% |
| Assyrians/Chaldeans/Syriacs | 0.6 /100 | #258 | Tragic 2.5% |
| Immigrants | Jamaica | 0.6 /100 | #259 | Tragic 2.5% |
| Immigrants | Ethiopia | 0.6 /100 | #260 | Tragic 2.5% |
| Armenians | 0.5 /100 | #261 | Tragic 2.5% |
| Immigrants | Sierra Leone | 0.5 /100 | #262 | Tragic 2.5% |
| Immigrants | Liberia | 0.4 /100 | #263 | Tragic 2.5% |
| Indians (Asian) | 0.4 /100 | #264 | Tragic 2.5% |
| West Indians | 0.4 /100 | #265 | Tragic 2.5% |
| Fijians | 0.4 /100 | #266 | Tragic 2.5% |
| Yuman | 0.4 /100 | #267 | Tragic 2.5% |
| Taiwanese | 0.3 /100 | #268 | Tragic 2.5% |
| Immigrants | Nigeria | 0.2 /100 | #269 | Tragic 2.5% |
| Immigrants | Peru | 0.2 /100 | #270 | Tragic 2.5% |
| Cubans | 0.2 /100 | #271 | Tragic 2.5% |
Demographics Similar to Slavs by No Schooling Completed
In terms of no schooling completed, the demographic groups most similar to Slavs are Kiowa (1.6%, a difference of 0.070%), American (1.7%, a difference of 0.12%), Austrian (1.6%, a difference of 0.23%), Tsimshian (1.7%, a difference of 0.42%), and Greek (1.6%, a difference of 0.54%).
| Demographics | Rating | Rank | No Schooling Completed |
| Immigrants | Canada | 99.8 /100 | #52 | Exceptional 1.6% |
| Creek | 99.8 /100 | #53 | Exceptional 1.6% |
| Crow | 99.8 /100 | #54 | Exceptional 1.6% |
| Greeks | 99.8 /100 | #55 | Exceptional 1.6% |
| Immigrants | North America | 99.8 /100 | #56 | Exceptional 1.6% |
| Austrians | 99.8 /100 | #57 | Exceptional 1.6% |
| Kiowa | 99.8 /100 | #58 | Exceptional 1.6% |
| Slavs | 99.8 /100 | #59 | Exceptional 1.7% |
| Americans | 99.8 /100 | #60 | Exceptional 1.7% |
| Tsimshian | 99.8 /100 | #61 | Exceptional 1.7% |
| Immigrants | Northern Europe | 99.8 /100 | #62 | Exceptional 1.7% |
| Russians | 99.8 /100 | #63 | Exceptional 1.7% |
| New Zealanders | 99.7 /100 | #64 | Exceptional 1.7% |
| Serbians | 99.7 /100 | #65 | Exceptional 1.7% |
| Canadians | 99.7 /100 | #66 | Exceptional 1.7% |