Immigrants from Thailand vs Slavic No Schooling Completed
COMPARE
Immigrants from Thailand
Slavic
No Schooling Completed
No Schooling Completed Comparison
Immigrants from Thailand
Slavs
2.7%
NO SCHOOLING COMPLETED
0.0/ 100
METRIC RATING
289th/ 347
METRIC RANK
1.7%
NO SCHOOLING COMPLETED
99.8/ 100
METRIC RATING
59th/ 347
METRIC RANK
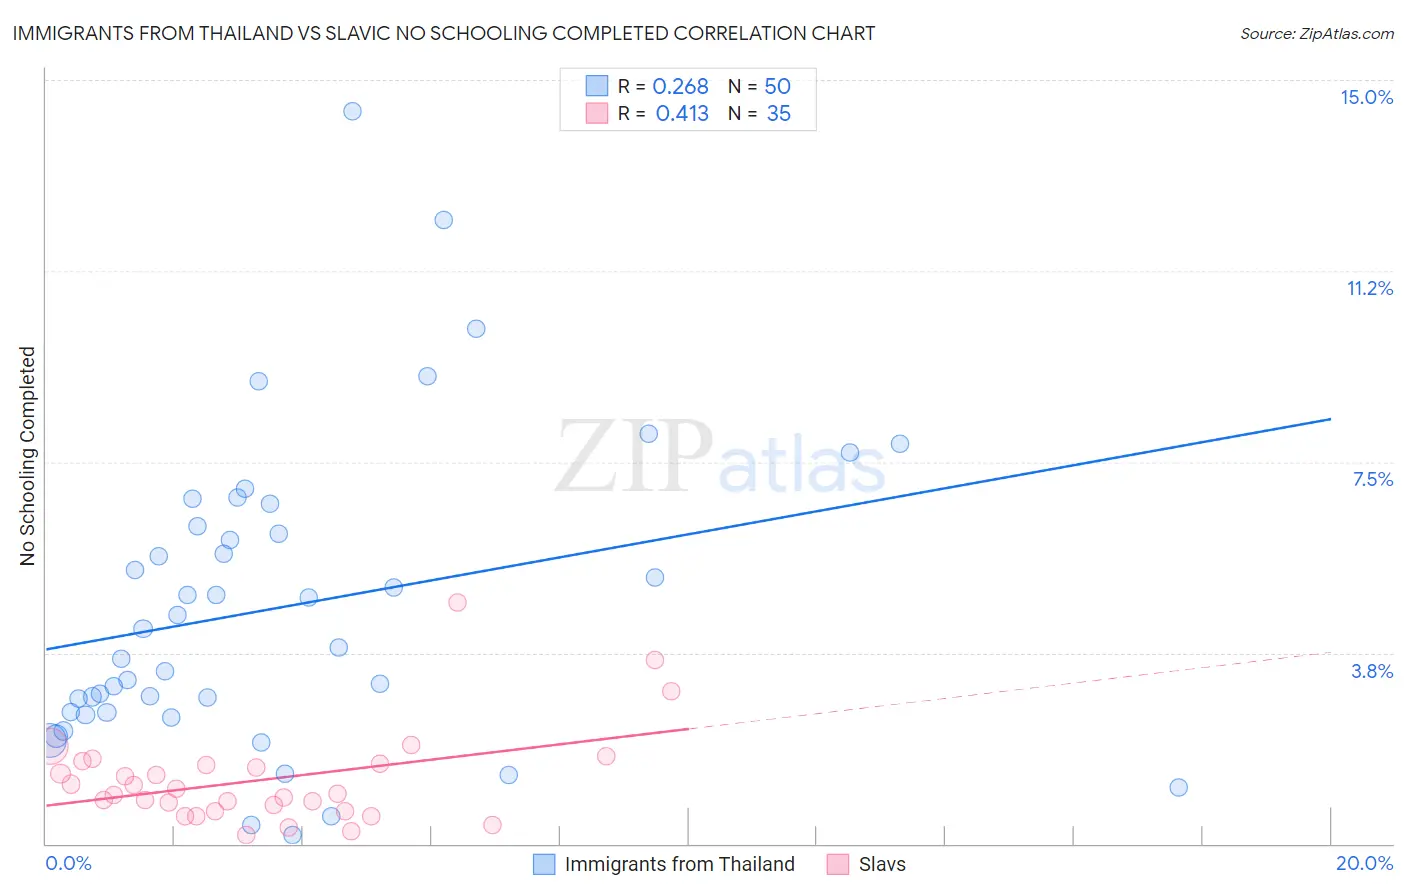
Immigrants from Thailand vs Slavic No Schooling Completed Correlation Chart
The statistical analysis conducted on geographies consisting of 315,042,408 people shows a weak positive correlation between the proportion of Immigrants from Thailand and percentage of population with no schooling in the United States with a correlation coefficient (R) of 0.268 and weighted average of 2.7%. Similarly, the statistical analysis conducted on geographies consisting of 268,525,041 people shows a moderate positive correlation between the proportion of Slavs and percentage of population with no schooling in the United States with a correlation coefficient (R) of 0.413 and weighted average of 1.7%, a difference of 63.7%.
No Schooling Completed Correlation Summary
| Measurement | Immigrants from Thailand | Slavic |
| Minimum | 0.18% | 0.17% |
| Maximum | 14.4% | 4.7% |
| Range | 14.2% | 4.6% |
| Mean | 4.7% | 1.3% |
| Median | 4.0% | 0.98% |
| Interquartile 25% (IQ1) | 2.6% | 0.64% |
| Interquartile 75% (IQ3) | 6.2% | 1.6% |
| Interquartile Range (IQR) | 3.6% | 0.93% |
| Standard Deviation (Sample) | 3.0% | 0.94% |
| Standard Deviation (Population) | 3.0% | 0.93% |
Similar Demographics by No Schooling Completed
Demographics Similar to Immigrants from Thailand by No Schooling Completed
In terms of no schooling completed, the demographic groups most similar to Immigrants from Thailand are Immigrants from Hong Kong (2.7%, a difference of 0.060%), Immigrants from St. Vincent and the Grenadines (2.7%, a difference of 0.32%), Immigrants from Afghanistan (2.7%, a difference of 0.42%), British West Indian (2.7%, a difference of 0.95%), and Immigrants from Portugal (2.7%, a difference of 1.2%).
| Demographics | Rating | Rank | No Schooling Completed |
| Immigrants | Ghana | 0.1 /100 | #282 | Tragic 2.6% |
| Immigrants | Trinidad and Tobago | 0.0 /100 | #283 | Tragic 2.6% |
| Immigrants | West Indies | 0.0 /100 | #284 | Tragic 2.7% |
| Immigrants | Barbados | 0.0 /100 | #285 | Tragic 2.7% |
| Immigrants | Portugal | 0.0 /100 | #286 | Tragic 2.7% |
| Immigrants | Afghanistan | 0.0 /100 | #287 | Tragic 2.7% |
| Immigrants | St. Vincent and the Grenadines | 0.0 /100 | #288 | Tragic 2.7% |
| Immigrants | Thailand | 0.0 /100 | #289 | Tragic 2.7% |
| Immigrants | Hong Kong | 0.0 /100 | #290 | Tragic 2.7% |
| British West Indians | 0.0 /100 | #291 | Tragic 2.7% |
| Immigrants | Grenada | 0.0 /100 | #292 | Tragic 2.8% |
| Malaysians | 0.0 /100 | #293 | Tragic 2.8% |
| Immigrants | Eritrea | 0.0 /100 | #294 | Tragic 2.8% |
| Houma | 0.0 /100 | #295 | Tragic 2.8% |
| Immigrants | Immigrants | 0.0 /100 | #296 | Tragic 2.8% |
Demographics Similar to Slavs by No Schooling Completed
In terms of no schooling completed, the demographic groups most similar to Slavs are Kiowa (1.6%, a difference of 0.070%), American (1.7%, a difference of 0.12%), Austrian (1.6%, a difference of 0.23%), Tsimshian (1.7%, a difference of 0.42%), and Greek (1.6%, a difference of 0.54%).
| Demographics | Rating | Rank | No Schooling Completed |
| Immigrants | Canada | 99.8 /100 | #52 | Exceptional 1.6% |
| Creek | 99.8 /100 | #53 | Exceptional 1.6% |
| Crow | 99.8 /100 | #54 | Exceptional 1.6% |
| Greeks | 99.8 /100 | #55 | Exceptional 1.6% |
| Immigrants | North America | 99.8 /100 | #56 | Exceptional 1.6% |
| Austrians | 99.8 /100 | #57 | Exceptional 1.6% |
| Kiowa | 99.8 /100 | #58 | Exceptional 1.6% |
| Slavs | 99.8 /100 | #59 | Exceptional 1.7% |
| Americans | 99.8 /100 | #60 | Exceptional 1.7% |
| Tsimshian | 99.8 /100 | #61 | Exceptional 1.7% |
| Immigrants | Northern Europe | 99.8 /100 | #62 | Exceptional 1.7% |
| Russians | 99.8 /100 | #63 | Exceptional 1.7% |
| New Zealanders | 99.7 /100 | #64 | Exceptional 1.7% |
| Serbians | 99.7 /100 | #65 | Exceptional 1.7% |
| Canadians | 99.7 /100 | #66 | Exceptional 1.7% |