Macedonian vs Immigrants from Turkey Bachelor's Degree
COMPARE
Macedonian
Immigrants from Turkey
Bachelor's Degree
Bachelor's Degree Comparison
Macedonians
Immigrants from Turkey
41.4%
BACHELOR'S DEGREE
98.1/ 100
METRIC RATING
100th/ 347
METRIC RANK
46.0%
BACHELOR'S DEGREE
100.0/ 100
METRIC RATING
32nd/ 347
METRIC RANK
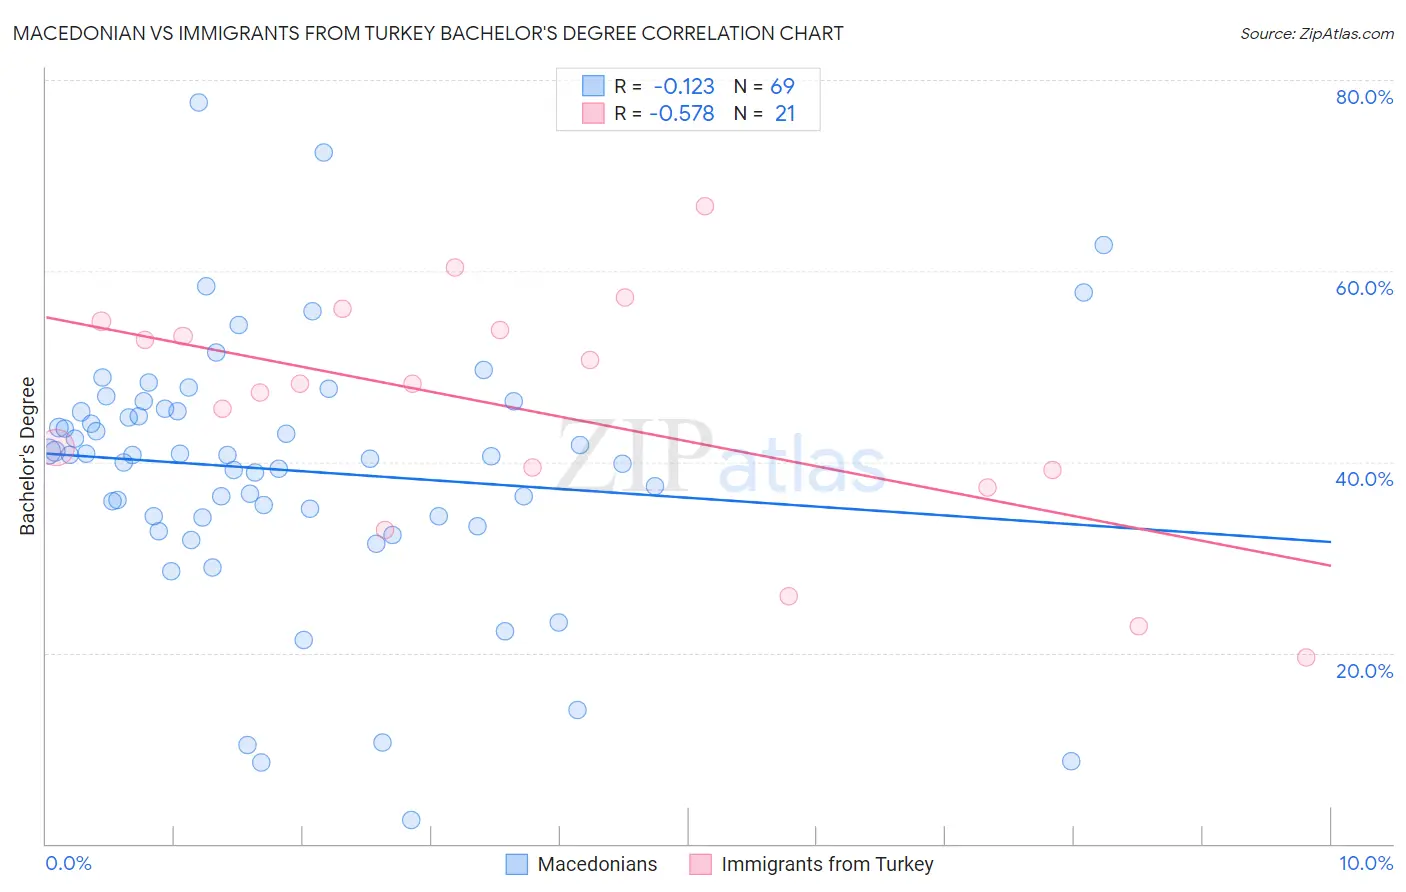
Macedonian vs Immigrants from Turkey Bachelor's Degree Correlation Chart
The statistical analysis conducted on geographies consisting of 132,656,802 people shows a poor negative correlation between the proportion of Macedonians and percentage of population with at least bachelor's degree education in the United States with a correlation coefficient (R) of -0.123 and weighted average of 41.4%. Similarly, the statistical analysis conducted on geographies consisting of 223,053,231 people shows a substantial negative correlation between the proportion of Immigrants from Turkey and percentage of population with at least bachelor's degree education in the United States with a correlation coefficient (R) of -0.578 and weighted average of 46.0%, a difference of 10.9%.
Bachelor's Degree Correlation Summary
| Measurement | Macedonian | Immigrants from Turkey |
| Minimum | 2.5% | 19.5% |
| Maximum | 77.6% | 66.8% |
| Range | 75.1% | 47.3% |
| Mean | 39.1% | 45.4% |
| Median | 40.7% | 48.1% |
| Interquartile 25% (IQ1) | 34.2% | 38.2% |
| Interquartile 75% (IQ3) | 45.5% | 54.2% |
| Interquartile Range (IQR) | 11.3% | 16.0% |
| Standard Deviation (Sample) | 13.5% | 12.5% |
| Standard Deviation (Population) | 13.4% | 12.2% |
Similar Demographics by Bachelor's Degree
Demographics Similar to Macedonians by Bachelor's Degree
In terms of bachelor's degree, the demographic groups most similar to Macedonians are Immigrants from England (41.4%, a difference of 0.030%), Immigrants from Morocco (41.4%, a difference of 0.030%), Immigrants from Ukraine (41.5%, a difference of 0.26%), Immigrants from Italy (41.3%, a difference of 0.29%), and Romanian (41.6%, a difference of 0.37%).
| Demographics | Rating | Rank | Bachelor's Degree |
| Immigrants | Canada | 98.6 /100 | #93 | Exceptional 41.7% |
| Immigrants | Nepal | 98.6 /100 | #94 | Exceptional 41.7% |
| Immigrants | North America | 98.5 /100 | #95 | Exceptional 41.7% |
| Immigrants | Moldova | 98.4 /100 | #96 | Exceptional 41.6% |
| Romanians | 98.4 /100 | #97 | Exceptional 41.6% |
| Immigrants | Ukraine | 98.3 /100 | #98 | Exceptional 41.5% |
| Immigrants | England | 98.1 /100 | #99 | Exceptional 41.4% |
| Macedonians | 98.1 /100 | #100 | Exceptional 41.4% |
| Immigrants | Morocco | 98.0 /100 | #101 | Exceptional 41.4% |
| Immigrants | Italy | 97.8 /100 | #102 | Exceptional 41.3% |
| Chileans | 97.5 /100 | #103 | Exceptional 41.2% |
| Jordanians | 97.4 /100 | #104 | Exceptional 41.2% |
| Syrians | 97.4 /100 | #105 | Exceptional 41.1% |
| Alsatians | 97.0 /100 | #106 | Exceptional 41.0% |
| Northern Europeans | 96.8 /100 | #107 | Exceptional 41.0% |
Demographics Similar to Immigrants from Turkey by Bachelor's Degree
In terms of bachelor's degree, the demographic groups most similar to Immigrants from Turkey are Latvian (46.1%, a difference of 0.30%), Immigrants from Sri Lanka (46.1%, a difference of 0.34%), Israeli (46.1%, a difference of 0.39%), Turkish (46.2%, a difference of 0.52%), and Immigrants from Northern Europe (45.6%, a difference of 0.70%).
| Demographics | Rating | Rank | Bachelor's Degree |
| Burmese | 100.0 /100 | #25 | Exceptional 46.9% |
| Immigrants | Japan | 100.0 /100 | #26 | Exceptional 46.8% |
| Immigrants | France | 100.0 /100 | #27 | Exceptional 46.4% |
| Turks | 100.0 /100 | #28 | Exceptional 46.2% |
| Israelis | 100.0 /100 | #29 | Exceptional 46.1% |
| Immigrants | Sri Lanka | 100.0 /100 | #30 | Exceptional 46.1% |
| Latvians | 100.0 /100 | #31 | Exceptional 46.1% |
| Immigrants | Turkey | 100.0 /100 | #32 | Exceptional 46.0% |
| Immigrants | Northern Europe | 100.0 /100 | #33 | Exceptional 45.6% |
| Immigrants | Denmark | 100.0 /100 | #34 | Exceptional 45.4% |
| Immigrants | Russia | 100.0 /100 | #35 | Exceptional 45.4% |
| Mongolians | 100.0 /100 | #36 | Exceptional 45.4% |
| Russians | 100.0 /100 | #37 | Exceptional 45.3% |
| Bulgarians | 100.0 /100 | #38 | Exceptional 45.3% |
| Immigrants | Latvia | 100.0 /100 | #39 | Exceptional 45.1% |