Macedonian vs Immigrants from Syria Bachelor's Degree
COMPARE
Macedonian
Immigrants from Syria
Bachelor's Degree
Bachelor's Degree Comparison
Macedonians
Immigrants from Syria
41.4%
BACHELOR'S DEGREE
98.1/ 100
METRIC RATING
100th/ 347
METRIC RANK
40.5%
BACHELOR'S DEGREE
94.9/ 100
METRIC RATING
119th/ 347
METRIC RANK
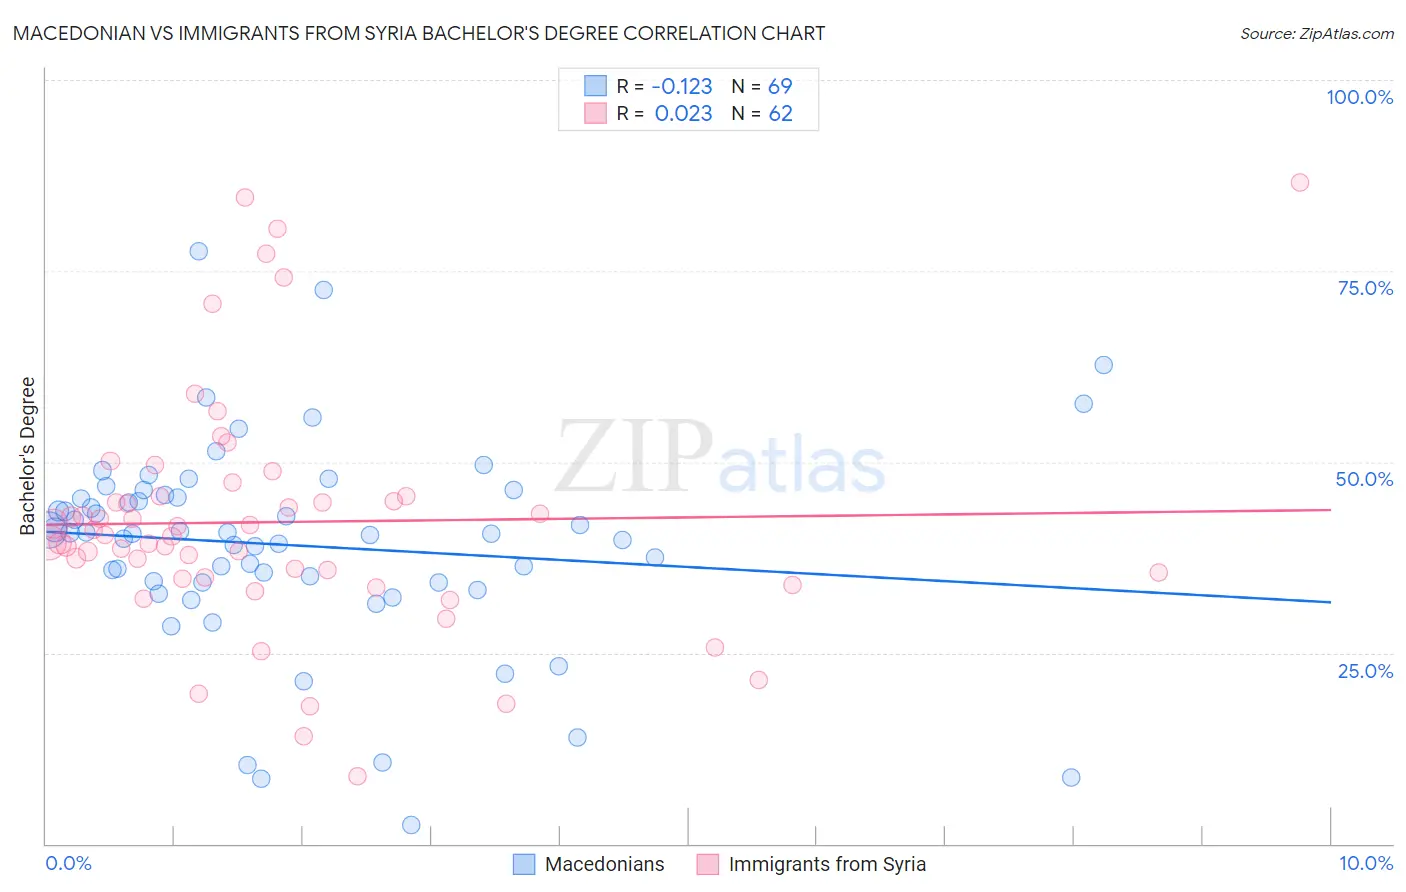
Macedonian vs Immigrants from Syria Bachelor's Degree Correlation Chart
The statistical analysis conducted on geographies consisting of 132,656,802 people shows a poor negative correlation between the proportion of Macedonians and percentage of population with at least bachelor's degree education in the United States with a correlation coefficient (R) of -0.123 and weighted average of 41.4%. Similarly, the statistical analysis conducted on geographies consisting of 174,109,130 people shows no correlation between the proportion of Immigrants from Syria and percentage of population with at least bachelor's degree education in the United States with a correlation coefficient (R) of 0.023 and weighted average of 40.5%, a difference of 2.3%.
Bachelor's Degree Correlation Summary
| Measurement | Macedonian | Immigrants from Syria |
| Minimum | 2.5% | 8.8% |
| Maximum | 77.6% | 86.6% |
| Range | 75.1% | 77.8% |
| Mean | 39.1% | 42.1% |
| Median | 40.7% | 40.3% |
| Interquartile 25% (IQ1) | 34.2% | 34.9% |
| Interquartile 75% (IQ3) | 45.5% | 45.5% |
| Interquartile Range (IQR) | 11.3% | 10.5% |
| Standard Deviation (Sample) | 13.5% | 15.6% |
| Standard Deviation (Population) | 13.4% | 15.5% |
Demographics Similar to Macedonians and Immigrants from Syria by Bachelor's Degree
In terms of bachelor's degree, the demographic groups most similar to Macedonians are Immigrants from England (41.4%, a difference of 0.030%), Immigrants from Morocco (41.4%, a difference of 0.030%), Immigrants from Italy (41.3%, a difference of 0.29%), Chilean (41.2%, a difference of 0.63%), and Jordanian (41.2%, a difference of 0.69%). Similarly, the demographic groups most similar to Immigrants from Syria are Croatian (40.6%, a difference of 0.32%), Austrian (40.6%, a difference of 0.34%), Immigrants from Uganda (40.7%, a difference of 0.44%), Palestinian (40.7%, a difference of 0.49%), and Afghan (40.8%, a difference of 0.73%).
| Demographics | Rating | Rank | Bachelor's Degree |
| Immigrants | England | 98.1 /100 | #99 | Exceptional 41.4% |
| Macedonians | 98.1 /100 | #100 | Exceptional 41.4% |
| Immigrants | Morocco | 98.0 /100 | #101 | Exceptional 41.4% |
| Immigrants | Italy | 97.8 /100 | #102 | Exceptional 41.3% |
| Chileans | 97.5 /100 | #103 | Exceptional 41.2% |
| Jordanians | 97.4 /100 | #104 | Exceptional 41.2% |
| Syrians | 97.4 /100 | #105 | Exceptional 41.1% |
| Alsatians | 97.0 /100 | #106 | Exceptional 41.0% |
| Northern Europeans | 96.8 /100 | #107 | Exceptional 41.0% |
| Ukrainians | 96.6 /100 | #108 | Exceptional 40.9% |
| Arabs | 96.6 /100 | #109 | Exceptional 40.9% |
| Albanians | 96.5 /100 | #110 | Exceptional 40.9% |
| Immigrants | Chile | 96.4 /100 | #111 | Exceptional 40.8% |
| Ugandans | 96.3 /100 | #112 | Exceptional 40.8% |
| Brazilians | 96.3 /100 | #113 | Exceptional 40.8% |
| Afghans | 96.2 /100 | #114 | Exceptional 40.8% |
| Palestinians | 95.8 /100 | #115 | Exceptional 40.7% |
| Immigrants | Uganda | 95.7 /100 | #116 | Exceptional 40.7% |
| Austrians | 95.5 /100 | #117 | Exceptional 40.6% |
| Croatians | 95.5 /100 | #118 | Exceptional 40.6% |
| Immigrants | Syria | 94.9 /100 | #119 | Exceptional 40.5% |