Macedonian vs Immigrants from Saudi Arabia Bachelor's Degree
COMPARE
Macedonian
Immigrants from Saudi Arabia
Bachelor's Degree
Bachelor's Degree Comparison
Macedonians
Immigrants from Saudi Arabia
41.4%
BACHELOR'S DEGREE
98.1/ 100
METRIC RATING
100th/ 347
METRIC RANK
44.8%
BACHELOR'S DEGREE
100.0/ 100
METRIC RATING
42nd/ 347
METRIC RANK
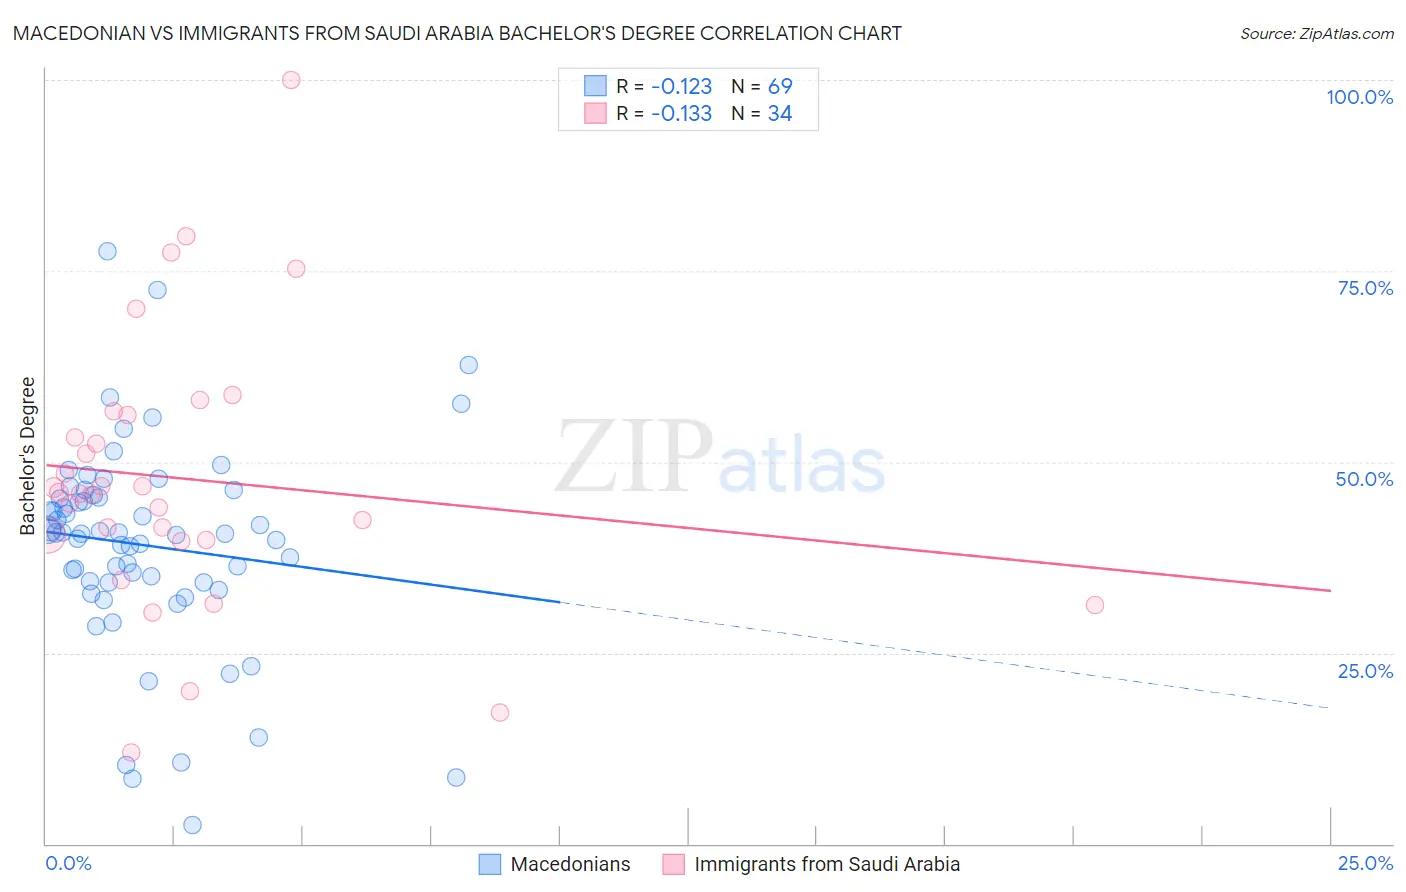
Macedonian vs Immigrants from Saudi Arabia Bachelor's Degree Correlation Chart
The statistical analysis conducted on geographies consisting of 132,656,802 people shows a poor negative correlation between the proportion of Macedonians and percentage of population with at least bachelor's degree education in the United States with a correlation coefficient (R) of -0.123 and weighted average of 41.4%. Similarly, the statistical analysis conducted on geographies consisting of 164,289,450 people shows a poor negative correlation between the proportion of Immigrants from Saudi Arabia and percentage of population with at least bachelor's degree education in the United States with a correlation coefficient (R) of -0.133 and weighted average of 44.8%, a difference of 8.2%.
Bachelor's Degree Correlation Summary
| Measurement | Macedonian | Immigrants from Saudi Arabia |
| Minimum | 2.5% | 11.9% |
| Maximum | 77.6% | 100.0% |
| Range | 75.1% | 88.1% |
| Mean | 39.1% | 47.8% |
| Median | 40.7% | 45.9% |
| Interquartile 25% (IQ1) | 34.2% | 39.7% |
| Interquartile 75% (IQ3) | 45.5% | 56.1% |
| Interquartile Range (IQR) | 11.3% | 16.4% |
| Standard Deviation (Sample) | 13.5% | 18.0% |
| Standard Deviation (Population) | 13.4% | 17.7% |
Similar Demographics by Bachelor's Degree
Demographics Similar to Macedonians by Bachelor's Degree
In terms of bachelor's degree, the demographic groups most similar to Macedonians are Immigrants from England (41.4%, a difference of 0.030%), Immigrants from Morocco (41.4%, a difference of 0.030%), Immigrants from Ukraine (41.5%, a difference of 0.26%), Immigrants from Italy (41.3%, a difference of 0.29%), and Romanian (41.6%, a difference of 0.37%).
| Demographics | Rating | Rank | Bachelor's Degree |
| Immigrants | Canada | 98.6 /100 | #93 | Exceptional 41.7% |
| Immigrants | Nepal | 98.6 /100 | #94 | Exceptional 41.7% |
| Immigrants | North America | 98.5 /100 | #95 | Exceptional 41.7% |
| Immigrants | Moldova | 98.4 /100 | #96 | Exceptional 41.6% |
| Romanians | 98.4 /100 | #97 | Exceptional 41.6% |
| Immigrants | Ukraine | 98.3 /100 | #98 | Exceptional 41.5% |
| Immigrants | England | 98.1 /100 | #99 | Exceptional 41.4% |
| Macedonians | 98.1 /100 | #100 | Exceptional 41.4% |
| Immigrants | Morocco | 98.0 /100 | #101 | Exceptional 41.4% |
| Immigrants | Italy | 97.8 /100 | #102 | Exceptional 41.3% |
| Chileans | 97.5 /100 | #103 | Exceptional 41.2% |
| Jordanians | 97.4 /100 | #104 | Exceptional 41.2% |
| Syrians | 97.4 /100 | #105 | Exceptional 41.1% |
| Alsatians | 97.0 /100 | #106 | Exceptional 41.0% |
| Northern Europeans | 96.8 /100 | #107 | Exceptional 41.0% |
Demographics Similar to Immigrants from Saudi Arabia by Bachelor's Degree
In terms of bachelor's degree, the demographic groups most similar to Immigrants from Saudi Arabia are Immigrants from South Africa (44.8%, a difference of 0.14%), Immigrants from Malaysia (45.0%, a difference of 0.38%), Immigrants from Belarus (45.0%, a difference of 0.42%), Immigrants from Lithuania (44.6%, a difference of 0.49%), and Immigrants from Kuwait (44.6%, a difference of 0.52%).
| Demographics | Rating | Rank | Bachelor's Degree |
| Immigrants | Russia | 100.0 /100 | #35 | Exceptional 45.4% |
| Mongolians | 100.0 /100 | #36 | Exceptional 45.4% |
| Russians | 100.0 /100 | #37 | Exceptional 45.3% |
| Bulgarians | 100.0 /100 | #38 | Exceptional 45.3% |
| Immigrants | Latvia | 100.0 /100 | #39 | Exceptional 45.1% |
| Immigrants | Belarus | 100.0 /100 | #40 | Exceptional 45.0% |
| Immigrants | Malaysia | 100.0 /100 | #41 | Exceptional 45.0% |
| Immigrants | Saudi Arabia | 100.0 /100 | #42 | Exceptional 44.8% |
| Immigrants | South Africa | 99.9 /100 | #43 | Exceptional 44.8% |
| Immigrants | Lithuania | 99.9 /100 | #44 | Exceptional 44.6% |
| Immigrants | Kuwait | 99.9 /100 | #45 | Exceptional 44.6% |
| Immigrants | Bulgaria | 99.9 /100 | #46 | Exceptional 44.6% |
| Bolivians | 99.9 /100 | #47 | Exceptional 44.6% |
| Estonians | 99.9 /100 | #48 | Exceptional 44.6% |
| Immigrants | Norway | 99.9 /100 | #49 | Exceptional 44.5% |