Macedonian vs Immigrants from Europe Child Poverty Under the Age of 16
COMPARE
Macedonian
Immigrants from Europe
Child Poverty Under the Age of 16
Child Poverty Under the Age of 16 Comparison
Macedonians
Immigrants from Europe
14.4%
CHILD POVERTY UNDER THE AGE OF 16
97.6/ 100
METRIC RATING
74th/ 347
METRIC RANK
14.2%
CHILD POVERTY UNDER THE AGE OF 16
98.4/ 100
METRIC RATING
63rd/ 347
METRIC RANK
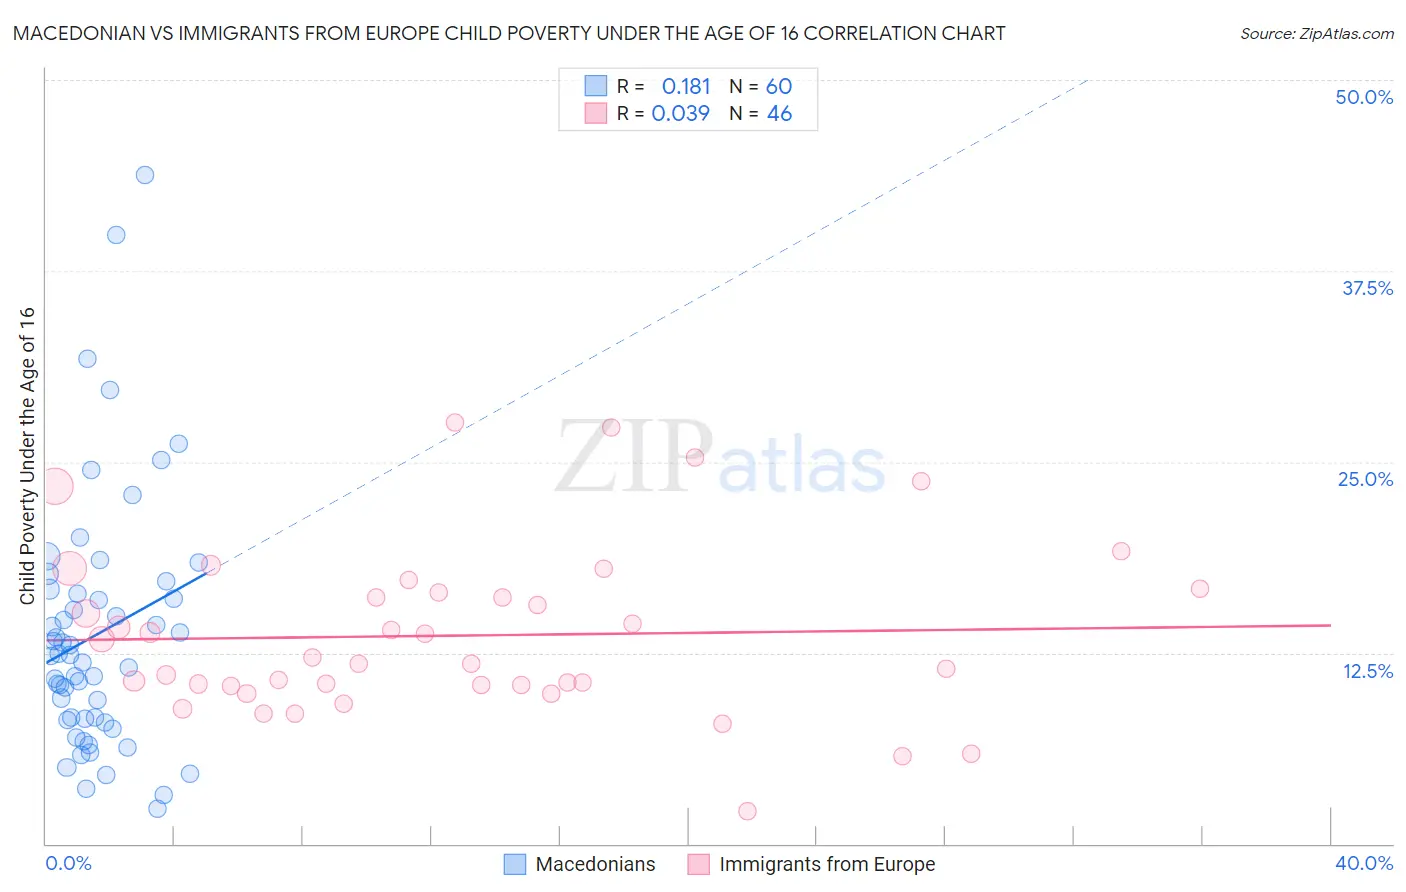
Macedonian vs Immigrants from Europe Child Poverty Under the Age of 16 Correlation Chart
The statistical analysis conducted on geographies consisting of 131,993,313 people shows a poor positive correlation between the proportion of Macedonians and poverty level among children under the age of 16 in the United States with a correlation coefficient (R) of 0.181 and weighted average of 14.4%. Similarly, the statistical analysis conducted on geographies consisting of 536,681,796 people shows no correlation between the proportion of Immigrants from Europe and poverty level among children under the age of 16 in the United States with a correlation coefficient (R) of 0.039 and weighted average of 14.2%, a difference of 1.3%.
Child Poverty Under the Age of 16 Correlation Summary
| Measurement | Macedonian | Immigrants from Europe |
| Minimum | 2.3% | 2.1% |
| Maximum | 43.8% | 27.6% |
| Range | 41.4% | 25.5% |
| Mean | 13.7% | 13.6% |
| Median | 12.3% | 12.0% |
| Interquartile 25% (IQ1) | 8.1% | 10.4% |
| Interquartile 75% (IQ3) | 16.5% | 16.5% |
| Interquartile Range (IQR) | 8.4% | 6.1% |
| Standard Deviation (Sample) | 8.3% | 5.5% |
| Standard Deviation (Population) | 8.2% | 5.5% |
Demographics Similar to Macedonians and Immigrants from Europe by Child Poverty Under the Age of 16
In terms of child poverty under the age of 16, the demographic groups most similar to Macedonians are Immigrants from Turkey (14.4%, a difference of 0.0%), Ukrainian (14.4%, a difference of 0.20%), Cambodian (14.4%, a difference of 0.21%), Immigrants from Eastern Europe (14.4%, a difference of 0.21%), and Australian (14.4%, a difference of 0.24%). Similarly, the demographic groups most similar to Immigrants from Europe are Immigrants from Romania (14.2%, a difference of 0.13%), Zimbabwean (14.2%, a difference of 0.31%), Immigrants from Sweden (14.2%, a difference of 0.32%), Immigrants from Austria (14.2%, a difference of 0.36%), and Immigrants from Philippines (14.3%, a difference of 0.39%).
| Demographics | Rating | Rank | Child Poverty Under the Age of 16 |
| Immigrants | Pakistan | 98.6 /100 | #58 | Exceptional 14.1% |
| Scandinavians | 98.6 /100 | #59 | Exceptional 14.1% |
| Immigrants | Austria | 98.5 /100 | #60 | Exceptional 14.2% |
| Immigrants | Sweden | 98.5 /100 | #61 | Exceptional 14.2% |
| Zimbabweans | 98.5 /100 | #62 | Exceptional 14.2% |
| Immigrants | Europe | 98.4 /100 | #63 | Exceptional 14.2% |
| Immigrants | Romania | 98.3 /100 | #64 | Exceptional 14.2% |
| Immigrants | Philippines | 98.2 /100 | #65 | Exceptional 14.3% |
| Slovenes | 98.1 /100 | #66 | Exceptional 14.3% |
| Europeans | 98.1 /100 | #67 | Exceptional 14.3% |
| Laotians | 98.0 /100 | #68 | Exceptional 14.3% |
| Immigrants | Bulgaria | 98.0 /100 | #69 | Exceptional 14.3% |
| Immigrants | Netherlands | 97.9 /100 | #70 | Exceptional 14.3% |
| Immigrants | Poland | 97.9 /100 | #71 | Exceptional 14.3% |
| Cambodians | 97.8 /100 | #72 | Exceptional 14.4% |
| Immigrants | Turkey | 97.6 /100 | #73 | Exceptional 14.4% |
| Macedonians | 97.6 /100 | #74 | Exceptional 14.4% |
| Ukrainians | 97.5 /100 | #75 | Exceptional 14.4% |
| Immigrants | Eastern Europe | 97.5 /100 | #76 | Exceptional 14.4% |
| Australians | 97.5 /100 | #77 | Exceptional 14.4% |
| Immigrants | Russia | 97.3 /100 | #78 | Exceptional 14.5% |