Macedonian vs Bermudan Bachelor's Degree
COMPARE
Macedonian
Bermudan
Bachelor's Degree
Bachelor's Degree Comparison
Macedonians
Bermudans
41.4%
BACHELOR'S DEGREE
98.1/ 100
METRIC RATING
100th/ 347
METRIC RANK
38.0%
BACHELOR'S DEGREE
54.2/ 100
METRIC RATING
171st/ 347
METRIC RANK
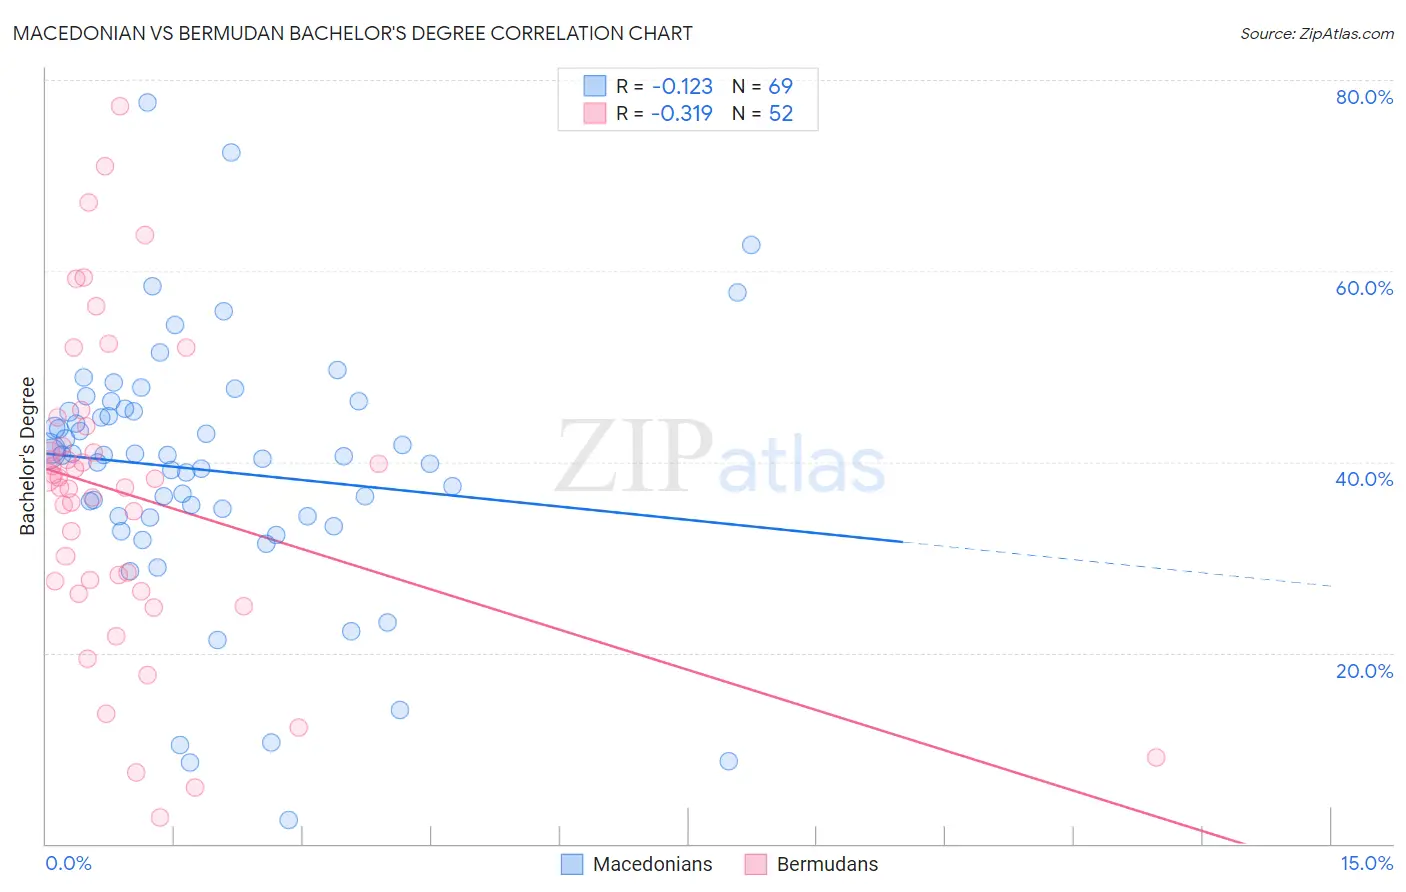
Macedonian vs Bermudan Bachelor's Degree Correlation Chart
The statistical analysis conducted on geographies consisting of 132,656,802 people shows a poor negative correlation between the proportion of Macedonians and percentage of population with at least bachelor's degree education in the United States with a correlation coefficient (R) of -0.123 and weighted average of 41.4%. Similarly, the statistical analysis conducted on geographies consisting of 55,732,325 people shows a mild negative correlation between the proportion of Bermudans and percentage of population with at least bachelor's degree education in the United States with a correlation coefficient (R) of -0.319 and weighted average of 38.0%, a difference of 9.1%.
Bachelor's Degree Correlation Summary
| Measurement | Macedonian | Bermudan |
| Minimum | 2.5% | 2.7% |
| Maximum | 77.6% | 77.3% |
| Range | 75.1% | 74.5% |
| Mean | 39.1% | 36.6% |
| Median | 40.7% | 37.7% |
| Interquartile 25% (IQ1) | 34.2% | 27.0% |
| Interquartile 75% (IQ3) | 45.5% | 42.7% |
| Interquartile Range (IQR) | 11.3% | 15.7% |
| Standard Deviation (Sample) | 13.5% | 16.3% |
| Standard Deviation (Population) | 13.4% | 16.1% |
Similar Demographics by Bachelor's Degree
Demographics Similar to Macedonians by Bachelor's Degree
In terms of bachelor's degree, the demographic groups most similar to Macedonians are Immigrants from England (41.4%, a difference of 0.030%), Immigrants from Morocco (41.4%, a difference of 0.030%), Immigrants from Ukraine (41.5%, a difference of 0.26%), Immigrants from Italy (41.3%, a difference of 0.29%), and Romanian (41.6%, a difference of 0.37%).
| Demographics | Rating | Rank | Bachelor's Degree |
| Immigrants | Canada | 98.6 /100 | #93 | Exceptional 41.7% |
| Immigrants | Nepal | 98.6 /100 | #94 | Exceptional 41.7% |
| Immigrants | North America | 98.5 /100 | #95 | Exceptional 41.7% |
| Immigrants | Moldova | 98.4 /100 | #96 | Exceptional 41.6% |
| Romanians | 98.4 /100 | #97 | Exceptional 41.6% |
| Immigrants | Ukraine | 98.3 /100 | #98 | Exceptional 41.5% |
| Immigrants | England | 98.1 /100 | #99 | Exceptional 41.4% |
| Macedonians | 98.1 /100 | #100 | Exceptional 41.4% |
| Immigrants | Morocco | 98.0 /100 | #101 | Exceptional 41.4% |
| Immigrants | Italy | 97.8 /100 | #102 | Exceptional 41.3% |
| Chileans | 97.5 /100 | #103 | Exceptional 41.2% |
| Jordanians | 97.4 /100 | #104 | Exceptional 41.2% |
| Syrians | 97.4 /100 | #105 | Exceptional 41.1% |
| Alsatians | 97.0 /100 | #106 | Exceptional 41.0% |
| Northern Europeans | 96.8 /100 | #107 | Exceptional 41.0% |
Demographics Similar to Bermudans by Bachelor's Degree
In terms of bachelor's degree, the demographic groups most similar to Bermudans are Czech (38.0%, a difference of 0.010%), Ghanaian (38.0%, a difference of 0.11%), Immigrants from Somalia (37.9%, a difference of 0.14%), Immigrants from Iraq (37.9%, a difference of 0.16%), and Danish (38.1%, a difference of 0.20%).
| Demographics | Rating | Rank | Bachelor's Degree |
| Hungarians | 62.1 /100 | #164 | Good 38.3% |
| Sri Lankans | 59.1 /100 | #165 | Average 38.2% |
| Somalis | 58.6 /100 | #166 | Average 38.1% |
| Scottish | 56.6 /100 | #167 | Average 38.1% |
| Danes | 56.2 /100 | #168 | Average 38.1% |
| Ghanaians | 55.3 /100 | #169 | Average 38.0% |
| Czechs | 54.4 /100 | #170 | Average 38.0% |
| Bermudans | 54.2 /100 | #171 | Average 38.0% |
| Immigrants | Somalia | 52.8 /100 | #172 | Average 37.9% |
| Immigrants | Iraq | 52.5 /100 | #173 | Average 37.9% |
| Immigrants | Bangladesh | 50.0 /100 | #174 | Average 37.8% |
| Immigrants | Uruguay | 48.3 /100 | #175 | Average 37.8% |
| Costa Ricans | 47.6 /100 | #176 | Average 37.7% |
| Basques | 47.4 /100 | #177 | Average 37.7% |
| Immigrants | Cameroon | 46.8 /100 | #178 | Average 37.7% |