Cajun vs Filipino 8th Grade
COMPARE
Cajun
Filipino
8th Grade
8th Grade Comparison
Cajuns
Filipinos
96.3%
8TH GRADE
97.1/ 100
METRIC RATING
110th/ 347
METRIC RANK
96.2%
8TH GRADE
94.6/ 100
METRIC RATING
123rd/ 347
METRIC RANK
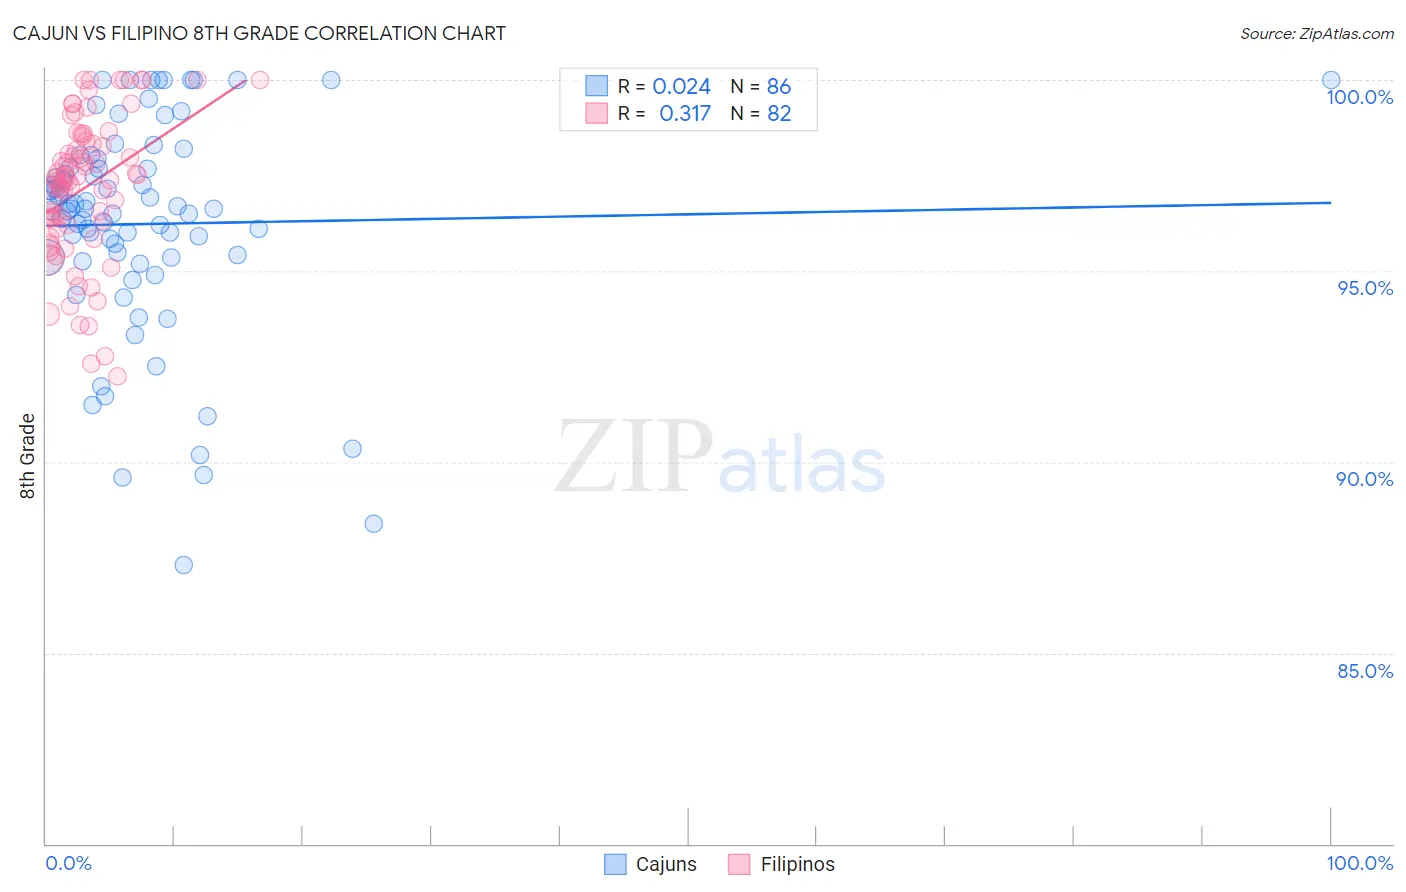
Cajun vs Filipino 8th Grade Correlation Chart
The statistical analysis conducted on geographies consisting of 149,712,957 people shows no correlation between the proportion of Cajuns and percentage of population with at least 8th grade education in the United States with a correlation coefficient (R) of 0.024 and weighted average of 96.3%. Similarly, the statistical analysis conducted on geographies consisting of 254,352,171 people shows a mild positive correlation between the proportion of Filipinos and percentage of population with at least 8th grade education in the United States with a correlation coefficient (R) of 0.317 and weighted average of 96.2%, a difference of 0.11%.
8th Grade Correlation Summary
| Measurement | Cajun | Filipino |
| Minimum | 87.3% | 92.3% |
| Maximum | 100.0% | 100.0% |
| Range | 12.7% | 7.7% |
| Mean | 96.2% | 97.2% |
| Median | 96.6% | 97.4% |
| Interquartile 25% (IQ1) | 95.4% | 96.2% |
| Interquartile 75% (IQ3) | 97.7% | 98.4% |
| Interquartile Range (IQR) | 2.4% | 2.2% |
| Standard Deviation (Sample) | 2.8% | 1.9% |
| Standard Deviation (Population) | 2.8% | 1.9% |
Demographics Similar to Cajuns and Filipinos by 8th Grade
In terms of 8th grade, the demographic groups most similar to Cajuns are Iroquois (96.3%, a difference of 0.020%), Shoshone (96.3%, a difference of 0.020%), Syrian (96.3%, a difference of 0.020%), Lebanese (96.3%, a difference of 0.030%), and Immigrants from Zimbabwe (96.3%, a difference of 0.030%). Similarly, the demographic groups most similar to Filipinos are Palestinian (96.2%, a difference of 0.0%), Immigrants from Switzerland (96.2%, a difference of 0.020%), Immigrants from France (96.2%, a difference of 0.020%), Immigrants from Bulgaria (96.2%, a difference of 0.020%), and Immigrants from Europe (96.2%, a difference of 0.020%).
| Demographics | Rating | Rank | 8th Grade |
| Okinawans | 98.0 /100 | #106 | Exceptional 96.3% |
| Immigrants | Latvia | 97.8 /100 | #107 | Exceptional 96.3% |
| Lebanese | 97.5 /100 | #108 | Exceptional 96.3% |
| Iroquois | 97.5 /100 | #109 | Exceptional 96.3% |
| Cajuns | 97.1 /100 | #110 | Exceptional 96.3% |
| Shoshone | 96.8 /100 | #111 | Exceptional 96.3% |
| Syrians | 96.7 /100 | #112 | Exceptional 96.3% |
| Immigrants | Zimbabwe | 96.7 /100 | #113 | Exceptional 96.3% |
| Immigrants | Japan | 96.5 /100 | #114 | Exceptional 96.2% |
| Immigrants | Moldova | 96.5 /100 | #115 | Exceptional 96.2% |
| Immigrants | Nonimmigrants | 96.0 /100 | #116 | Exceptional 96.2% |
| Immigrants | Croatia | 96.0 /100 | #117 | Exceptional 96.2% |
| Immigrants | Norway | 95.7 /100 | #118 | Exceptional 96.2% |
| Immigrants | Switzerland | 95.3 /100 | #119 | Exceptional 96.2% |
| Immigrants | France | 95.3 /100 | #120 | Exceptional 96.2% |
| Immigrants | Bulgaria | 95.3 /100 | #121 | Exceptional 96.2% |
| Immigrants | Europe | 95.3 /100 | #122 | Exceptional 96.2% |
| Filipinos | 94.6 /100 | #123 | Exceptional 96.2% |
| Palestinians | 94.6 /100 | #124 | Exceptional 96.2% |
| Immigrants | Romania | 94.1 /100 | #125 | Exceptional 96.2% |
| Choctaw | 94.0 /100 | #126 | Exceptional 96.2% |