Immigrants from Somalia vs Filipino 8th Grade
COMPARE
Immigrants from Somalia
Filipino
8th Grade
8th Grade Comparison
Immigrants from Somalia
Filipinos
95.0%
8TH GRADE
0.7/ 100
METRIC RATING
255th/ 347
METRIC RANK
96.2%
8TH GRADE
94.6/ 100
METRIC RATING
123rd/ 347
METRIC RANK
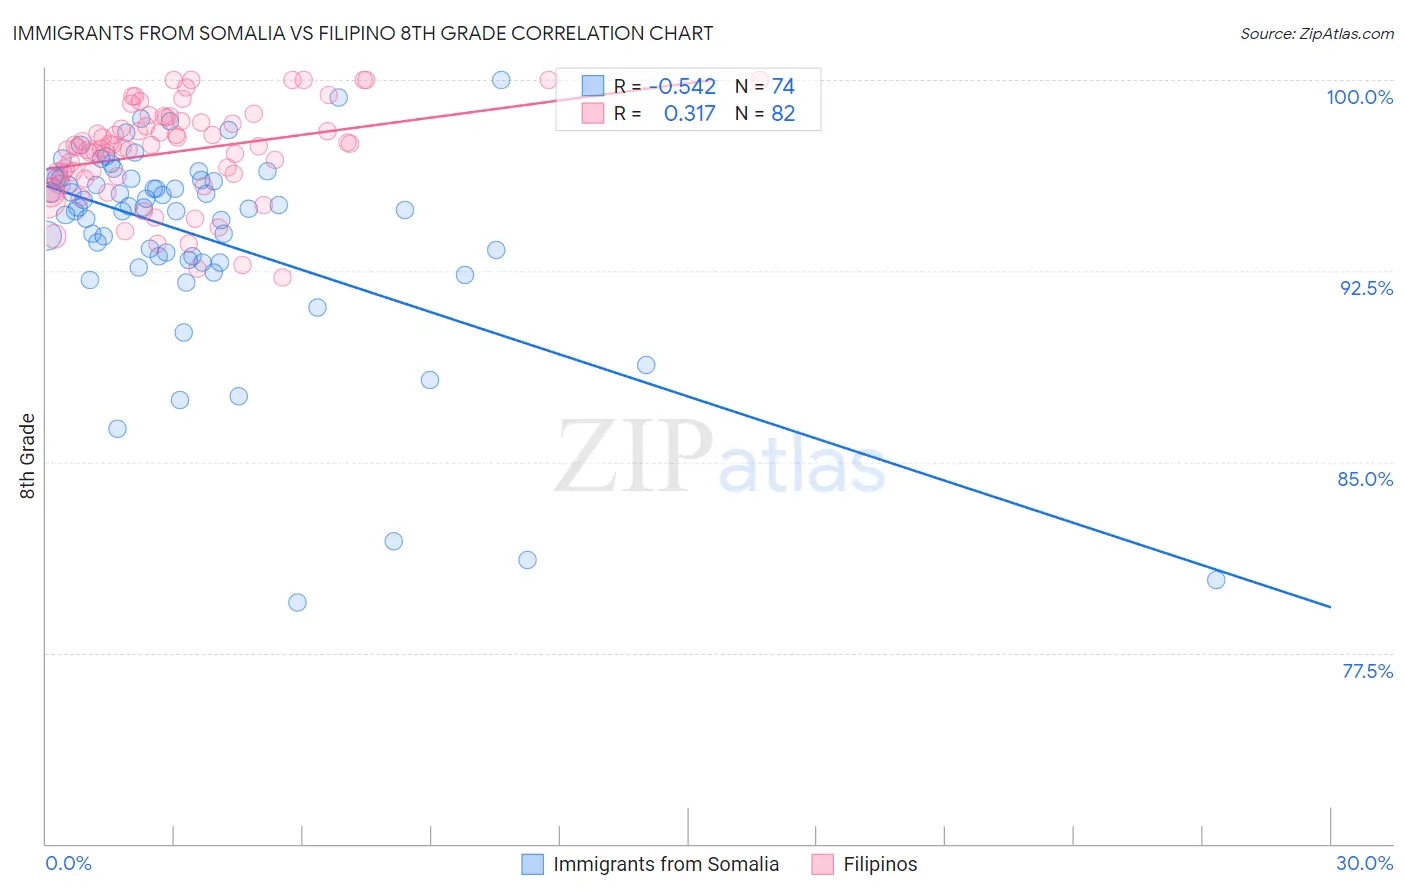
Immigrants from Somalia vs Filipino 8th Grade Correlation Chart
The statistical analysis conducted on geographies consisting of 92,098,504 people shows a substantial negative correlation between the proportion of Immigrants from Somalia and percentage of population with at least 8th grade education in the United States with a correlation coefficient (R) of -0.542 and weighted average of 95.0%. Similarly, the statistical analysis conducted on geographies consisting of 254,352,171 people shows a mild positive correlation between the proportion of Filipinos and percentage of population with at least 8th grade education in the United States with a correlation coefficient (R) of 0.317 and weighted average of 96.2%, a difference of 1.3%.
8th Grade Correlation Summary
| Measurement | Immigrants from Somalia | Filipino |
| Minimum | 79.5% | 92.3% |
| Maximum | 100.0% | 100.0% |
| Range | 20.5% | 7.7% |
| Mean | 93.8% | 97.2% |
| Median | 95.0% | 97.4% |
| Interquartile 25% (IQ1) | 92.9% | 96.2% |
| Interquartile 75% (IQ3) | 96.1% | 98.4% |
| Interquartile Range (IQR) | 3.2% | 2.2% |
| Standard Deviation (Sample) | 4.1% | 1.9% |
| Standard Deviation (Population) | 4.1% | 1.9% |
Similar Demographics by 8th Grade
Demographics Similar to Immigrants from Somalia by 8th Grade
In terms of 8th grade, the demographic groups most similar to Immigrants from Somalia are Colombian (95.0%, a difference of 0.010%), Immigrants from Cameroon (95.0%, a difference of 0.020%), Afghan (94.9%, a difference of 0.020%), Immigrants from Congo (94.9%, a difference of 0.030%), and Ghanaian (94.9%, a difference of 0.030%).
| Demographics | Rating | Rank | 8th Grade |
| Uruguayans | 1.2 /100 | #248 | Tragic 95.1% |
| Immigrants | China | 1.1 /100 | #249 | Tragic 95.0% |
| Koreans | 1.1 /100 | #250 | Tragic 95.0% |
| Bolivians | 1.0 /100 | #251 | Tragic 95.0% |
| Immigrants | Ethiopia | 1.0 /100 | #252 | Tragic 95.0% |
| U.S. Virgin Islanders | 0.9 /100 | #253 | Tragic 95.0% |
| Immigrants | Cameroon | 0.8 /100 | #254 | Tragic 95.0% |
| Immigrants | Somalia | 0.7 /100 | #255 | Tragic 95.0% |
| Colombians | 0.7 /100 | #256 | Tragic 95.0% |
| Afghans | 0.6 /100 | #257 | Tragic 94.9% |
| Immigrants | Congo | 0.6 /100 | #258 | Tragic 94.9% |
| Ghanaians | 0.6 /100 | #259 | Tragic 94.9% |
| Immigrants | Jamaica | 0.6 /100 | #260 | Tragic 94.9% |
| Immigrants | Costa Rica | 0.5 /100 | #261 | Tragic 94.9% |
| Immigrants | Nigeria | 0.4 /100 | #262 | Tragic 94.9% |
Demographics Similar to Filipinos by 8th Grade
In terms of 8th grade, the demographic groups most similar to Filipinos are Palestinian (96.2%, a difference of 0.0%), Immigrants from Switzerland (96.2%, a difference of 0.020%), Immigrants from France (96.2%, a difference of 0.020%), Immigrants from Bulgaria (96.2%, a difference of 0.020%), and Immigrants from Europe (96.2%, a difference of 0.020%).
| Demographics | Rating | Rank | 8th Grade |
| Immigrants | Nonimmigrants | 96.0 /100 | #116 | Exceptional 96.2% |
| Immigrants | Croatia | 96.0 /100 | #117 | Exceptional 96.2% |
| Immigrants | Norway | 95.7 /100 | #118 | Exceptional 96.2% |
| Immigrants | Switzerland | 95.3 /100 | #119 | Exceptional 96.2% |
| Immigrants | France | 95.3 /100 | #120 | Exceptional 96.2% |
| Immigrants | Bulgaria | 95.3 /100 | #121 | Exceptional 96.2% |
| Immigrants | Europe | 95.3 /100 | #122 | Exceptional 96.2% |
| Filipinos | 94.6 /100 | #123 | Exceptional 96.2% |
| Palestinians | 94.6 /100 | #124 | Exceptional 96.2% |
| Immigrants | Romania | 94.1 /100 | #125 | Exceptional 96.2% |
| Choctaw | 94.0 /100 | #126 | Exceptional 96.2% |
| Immigrants | Serbia | 94.0 /100 | #127 | Exceptional 96.2% |
| Immigrants | Bosnia and Herzegovina | 93.9 /100 | #128 | Exceptional 96.2% |
| Cheyenne | 93.3 /100 | #129 | Exceptional 96.1% |
| Soviet Union | 92.6 /100 | #130 | Exceptional 96.1% |