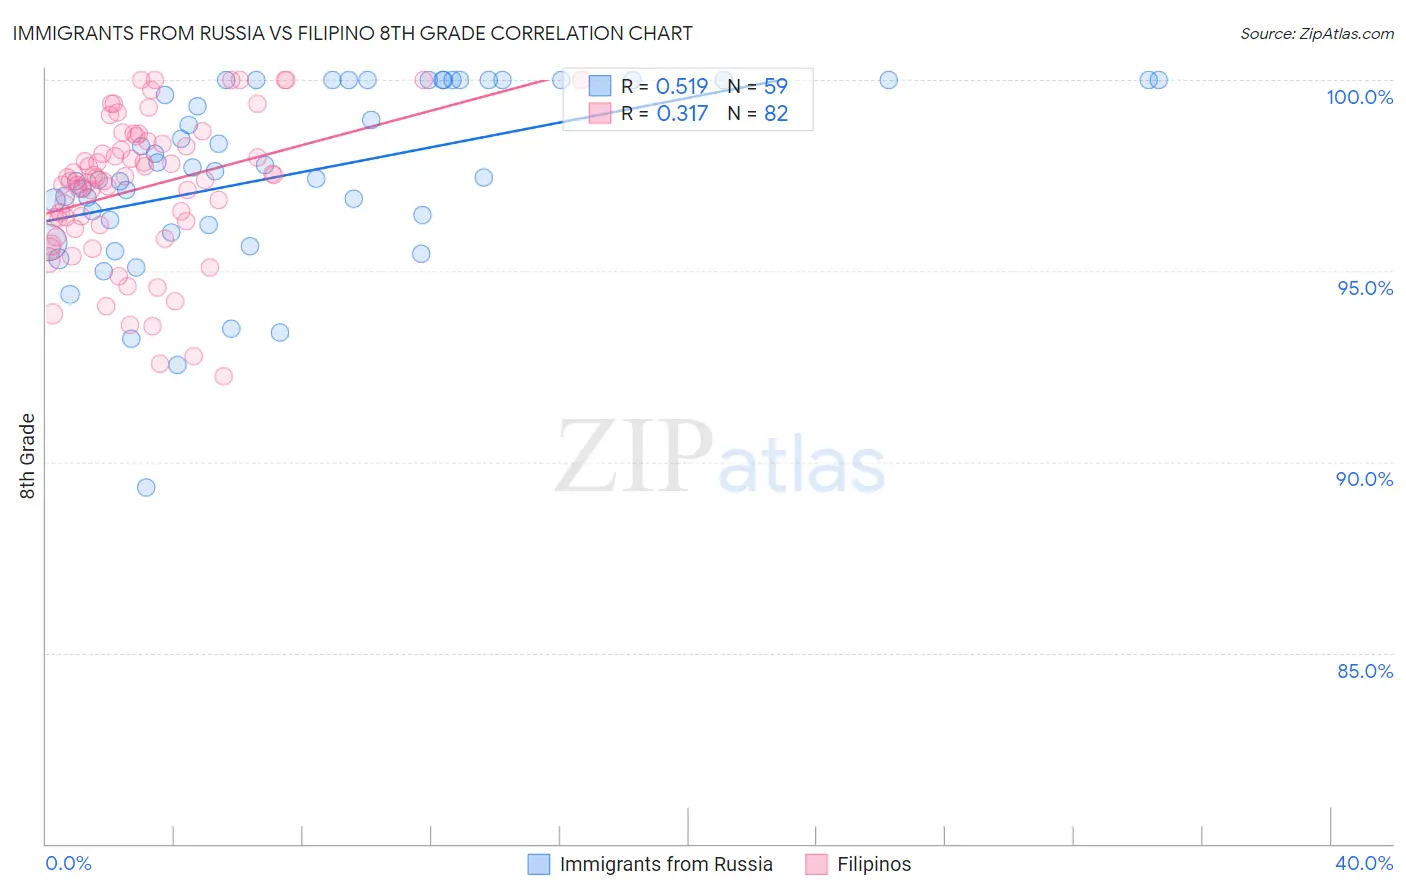
Immigrants from Russia vs Filipino 8th Grade
COMPARE
Immigrants from Russia
Filipino
8th Grade
8th Grade Comparison
Immigrants from Russia
Filipinos
96.0%
8TH GRADE
80.9/ 100
METRIC RATING
150th/ 347
METRIC RANK
96.2%
8TH GRADE
94.6/ 100
METRIC RATING
123rd/ 347
METRIC RANK
Immigrants from Russia vs Filipino 8th Grade Correlation Chart
The statistical analysis conducted on geographies consisting of 347,948,494 people shows a substantial positive correlation between the proportion of Immigrants from Russia and percentage of population with at least 8th grade education in the United States with a correlation coefficient (R) of 0.519 and weighted average of 96.0%. Similarly, the statistical analysis conducted on geographies consisting of 254,352,171 people shows a mild positive correlation between the proportion of Filipinos and percentage of population with at least 8th grade education in the United States with a correlation coefficient (R) of 0.317 and weighted average of 96.2%, a difference of 0.23%.
8th Grade Correlation Summary
| Measurement | Immigrants from Russia | Filipino |
| Minimum | 89.3% | 92.3% |
| Maximum | 100.0% | 100.0% |
| Range | 10.7% | 7.7% |
| Mean | 97.5% | 97.2% |
| Median | 97.6% | 97.4% |
| Interquartile 25% (IQ1) | 96.2% | 96.2% |
| Interquartile 75% (IQ3) | 100.0% | 98.4% |
| Interquartile Range (IQR) | 3.8% | 2.2% |
| Standard Deviation (Sample) | 2.3% | 1.9% |
| Standard Deviation (Population) | 2.3% | 1.9% |
Similar Demographics by 8th Grade
Demographics Similar to Immigrants from Russia by 8th Grade
In terms of 8th grade, the demographic groups most similar to Immigrants from Russia are Immigrants from Israel (96.0%, a difference of 0.0%), Blackfeet (96.0%, a difference of 0.0%), French American Indian (96.0%, a difference of 0.0%), Immigrants from Jordan (95.9%, a difference of 0.010%), and Albanian (96.0%, a difference of 0.020%).
| Demographics | Rating | Rank | 8th Grade |
| Spanish | 85.1 /100 | #143 | Excellent 96.0% |
| Immigrants | Belarus | 84.8 /100 | #144 | Excellent 96.0% |
| Lumbee | 84.1 /100 | #145 | Excellent 96.0% |
| Israelis | 84.1 /100 | #146 | Excellent 96.0% |
| Colville | 84.0 /100 | #147 | Excellent 96.0% |
| Albanians | 83.1 /100 | #148 | Excellent 96.0% |
| Immigrants | Israel | 81.3 /100 | #149 | Excellent 96.0% |
| Immigrants | Russia | 80.9 /100 | #150 | Excellent 96.0% |
| Blackfeet | 80.8 /100 | #151 | Excellent 96.0% |
| French American Indians | 80.6 /100 | #152 | Excellent 96.0% |
| Immigrants | Jordan | 79.5 /100 | #153 | Good 95.9% |
| Hopi | 79.4 /100 | #154 | Good 95.9% |
| Kenyans | 74.5 /100 | #155 | Good 95.9% |
| Ugandans | 74.1 /100 | #156 | Good 95.9% |
| Immigrants | Taiwan | 70.5 /100 | #157 | Good 95.9% |
Demographics Similar to Filipinos by 8th Grade
In terms of 8th grade, the demographic groups most similar to Filipinos are Palestinian (96.2%, a difference of 0.0%), Immigrants from Switzerland (96.2%, a difference of 0.020%), Immigrants from France (96.2%, a difference of 0.020%), Immigrants from Bulgaria (96.2%, a difference of 0.020%), and Immigrants from Europe (96.2%, a difference of 0.020%).
| Demographics | Rating | Rank | 8th Grade |
| Immigrants | Nonimmigrants | 96.0 /100 | #116 | Exceptional 96.2% |
| Immigrants | Croatia | 96.0 /100 | #117 | Exceptional 96.2% |
| Immigrants | Norway | 95.7 /100 | #118 | Exceptional 96.2% |
| Immigrants | Switzerland | 95.3 /100 | #119 | Exceptional 96.2% |
| Immigrants | France | 95.3 /100 | #120 | Exceptional 96.2% |
| Immigrants | Bulgaria | 95.3 /100 | #121 | Exceptional 96.2% |
| Immigrants | Europe | 95.3 /100 | #122 | Exceptional 96.2% |
| Filipinos | 94.6 /100 | #123 | Exceptional 96.2% |
| Palestinians | 94.6 /100 | #124 | Exceptional 96.2% |
| Immigrants | Romania | 94.1 /100 | #125 | Exceptional 96.2% |
| Choctaw | 94.0 /100 | #126 | Exceptional 96.2% |
| Immigrants | Serbia | 94.0 /100 | #127 | Exceptional 96.2% |
| Immigrants | Bosnia and Herzegovina | 93.9 /100 | #128 | Exceptional 96.2% |
| Cheyenne | 93.3 /100 | #129 | Exceptional 96.1% |
| Soviet Union | 92.6 /100 | #130 | Exceptional 96.1% |