Slovene vs Bermudan Bachelor's Degree

COMPARE

Slovene
Race
Ancestry
AfghanAfricanAlaska NativeAlaskan AthabascanAlbanianAleutAlsatianAmericanApacheArabArapahoArgentineanArmenianAssyrian/Chaldean/SyriacAustralianAustrianBahamianBangladeshiBarbadianBasqueBelgianBelizeanBhutaneseBlackfeetBolivianBrazilianBritishBritish West IndianBulgarianBurmeseCajunCambodianCanadianCape VerdeanCarpatho RusynCelticCentral AmericanCentral American IndianCherokeeCheyenneChickasawChileanChineseChippewaChoctawColombianColvilleComancheCosta RicanCreeCreekCroatianCrowCubanCypriotCzechCzechoslovakianDanishDelawareDominicanDutchDutch West IndianEastern EuropeanEcuadorianEgyptianEnglishEstonianEthiopianEuropeanFijianFilipinoFinnishFrenchFrench American IndianFrench CanadianGermanGerman RussianGhanaianGreekGuamanian/ChamorroGuatemalanGuyaneseHaitianHmongHonduranHopiHoumaHungarianIcelanderIndian (Asian)IndonesianInupiatIranianIraqiIrishIroquoisIsraeliItalianJamaicanJapaneseJordanianKenyanKiowaKoreanLaotianLatvianLebaneseLiberianLithuanianLumbeeLuxembourgerMacedonianMalaysianMalteseMarshalleseMenomineeMexicanMexican American IndianMongolianMoroccanNative HawaiianNavajoNepaleseNew ZealanderNicaraguanNigerianNorthern EuropeanNorwegianOkinawanOsageOttawaPaiutePakistaniPalestinianPanamanianParaguayanPennsylvania GermanPeruvianPimaPolishPortuguesePotawatomiPuebloPuerto RicanPuget Sound SalishRomanianRussianSalvadoranSamoanScandinavianScotch-IrishScottishSeminoleSenegaleseSerbianShoshoneSierra LeoneanSiouxSlavicSlovakSloveneSomaliSouth AfricanSouth AmericanSouth American IndianSoviet UnionSpaniardSpanishSpanish AmericanSpanish American IndianSri LankanSubsaharan AfricanSudaneseSwedishSwissSyrianTaiwaneseThaiTlingit-HaidaTohono O'OdhamTonganTrinidadian and TobagonianTsimshianTurkishU.S. Virgin IslanderUgandanUkrainianUruguayanUteVenezuelanVietnameseWelshWest IndianYakamaYaquiYugoslavianYumanYup'ikZimbabwean
Immigration
NonimmigrantsImmigrantsAfghanistanAfricaAlbaniaArgentinaArmeniaAsiaAustraliaAustriaBahamasBangladeshBarbadosBelarusBelgiumBelizeBoliviaBosnia and HerzegovinaBrazilBulgariaBurma/MyanmarCabo VerdeCambodiaCameroonCanadaCaribbeanCentral AmericaChileChinaColombiaCongoCosta RicaCroatiaCubaCzechoslovakiaDenmarkDominicaDominican RepublicEastern AfricaEastern AsiaEastern EuropeEcuadorEgyptEl SalvadorEnglandEritreaEthiopiaEuropeFijiFranceGermanyGhanaGreeceGrenadaGuatemalaGuyanaHaitiHondurasHong KongHungaryIndiaIndonesiaIranIraqIrelandIsraelItalyJamaicaJapanJordanKazakhstanKenyaKoreaKuwaitLaosLatin AmericaLatviaLebanonLiberiaLithuaniaMalaysiaMexicoMicronesiaMiddle AfricaMoldovaMoroccoNepalNetherlandsNicaraguaNigeriaNorth AmericaNorth MacedoniaNorthern AfricaNorthern EuropeNorwayOceaniaPakistanPanamaPeruPhilippinesPolandPortugalRomaniaRussiaSaudi ArabiaScotlandSenegalSerbiaSierra LeoneSingaporeSomaliaSouth AfricaSouth AmericaSouth Central AsiaSouth Eastern AsiaSouthern EuropeSpainSri LankaSt. Vincent and the GrenadinesSudanSwedenSwitzerlandSyriaTaiwanThailandTrinidad and TobagoTurkeyUgandaUkraineUruguayUzbekistanVenezuelaVietnamWest IndiesWestern AfricaWestern AsiaWestern EuropeYemenZaireZimbabweAzores
Bermudan
Race
Ancestry
AfghanAfricanAlaska NativeAlaskan AthabascanAlbanianAleutAlsatianAmericanApacheArabArapahoArgentineanArmenianAssyrian/Chaldean/SyriacAustralianAustrianBahamianBangladeshiBarbadianBasqueBelgianBelizeanBermudanBhutaneseBlackfeetBolivianBrazilianBritishBritish West IndianBulgarianBurmeseCajunCambodianCanadianCape VerdeanCarpatho RusynCelticCentral AmericanCentral American IndianCherokeeCheyenneChickasawChileanChineseChippewaChoctawColombianColvilleComancheCosta RicanCreeCreekCroatianCrowCubanCypriotCzechCzechoslovakianDanishDelawareDominicanDutchDutch West IndianEastern EuropeanEcuadorianEgyptianEnglishEstonianEthiopianEuropeanFijianFilipinoFinnishFrenchFrench American IndianFrench CanadianGermanGerman RussianGhanaianGreekGuamanian/ChamorroGuatemalanGuyaneseHaitianHmongHonduranHopiHoumaHungarianIcelanderIndian (Asian)IndonesianInupiatIranianIraqiIrishIroquoisIsraeliItalianJamaicanJapaneseJordanianKenyanKiowaKoreanLaotianLatvianLebaneseLiberianLithuanianLumbeeLuxembourgerMacedonianMalaysianMalteseMarshalleseMenomineeMexicanMexican American IndianMongolianMoroccanNative HawaiianNavajoNepaleseNew ZealanderNicaraguanNigerianNorthern EuropeanNorwegianOkinawanOsageOttawaPaiutePakistaniPalestinianPanamanianParaguayanPennsylvania GermanPeruvianPimaPolishPortuguesePotawatomiPuebloPuerto RicanPuget Sound SalishRomanianRussianSalvadoranSamoanScandinavianScotch-IrishScottishSeminoleSenegaleseSerbianShoshoneSierra LeoneanSiouxSlavicSlovakSomaliSouth AfricanSouth AmericanSouth American IndianSoviet UnionSpaniardSpanishSpanish AmericanSpanish American IndianSri LankanSubsaharan AfricanSudaneseSwedishSwissSyrianTaiwaneseThaiTlingit-HaidaTohono O'OdhamTonganTrinidadian and TobagonianTsimshianTurkishU.S. Virgin IslanderUgandanUkrainianUruguayanUteVenezuelanVietnameseWelshWest IndianYakamaYaquiYugoslavianYumanYup'ikZimbabwean
Immigration
NonimmigrantsImmigrantsAfghanistanAfricaAlbaniaArgentinaArmeniaAsiaAustraliaAustriaBahamasBangladeshBarbadosBelarusBelgiumBelizeBoliviaBosnia and HerzegovinaBrazilBulgariaBurma/MyanmarCabo VerdeCambodiaCameroonCanadaCaribbeanCentral AmericaChileChinaColombiaCongoCosta RicaCroatiaCubaCzechoslovakiaDenmarkDominicaDominican RepublicEastern AfricaEastern AsiaEastern EuropeEcuadorEgyptEl SalvadorEnglandEritreaEthiopiaEuropeFijiFranceGermanyGhanaGreeceGrenadaGuatemalaGuyanaHaitiHondurasHong KongHungaryIndiaIndonesiaIranIraqIrelandIsraelItalyJamaicaJapanJordanKazakhstanKenyaKoreaKuwaitLaosLatin AmericaLatviaLebanonLiberiaLithuaniaMalaysiaMexicoMicronesiaMiddle AfricaMoldovaMoroccoNepalNetherlandsNicaraguaNigeriaNorth AmericaNorth MacedoniaNorthern AfricaNorthern EuropeNorwayOceaniaPakistanPanamaPeruPhilippinesPolandPortugalRomaniaRussiaSaudi ArabiaScotlandSenegalSerbiaSierra LeoneSingaporeSomaliaSouth AfricaSouth AmericaSouth Central AsiaSouth Eastern AsiaSouthern EuropeSpainSri LankaSt. Vincent and the GrenadinesSudanSwedenSwitzerlandSyriaTaiwanThailandTrinidad and TobagoTurkeyUgandaUkraineUruguayUzbekistanVenezuelaVietnamWest IndiesWestern AfricaWestern AsiaWestern EuropeYemenZaireZimbabweAzores
Bachelor's Degree
Income
Poverty
Unemployment
Labor Participation
Family Structure
Vehicle Availability
Education Level
Disability

Bachelor's Degree Comparison

Slovenes

Bermudans

Good
Average
39.1%
BACHELOR'S DEGREE
79.5/ 100
METRIC RATING
145th/ 347
METRIC RANK
38.0%
BACHELOR'S DEGREE
54.2/ 100
METRIC RATING
171st/ 347
METRIC RANK

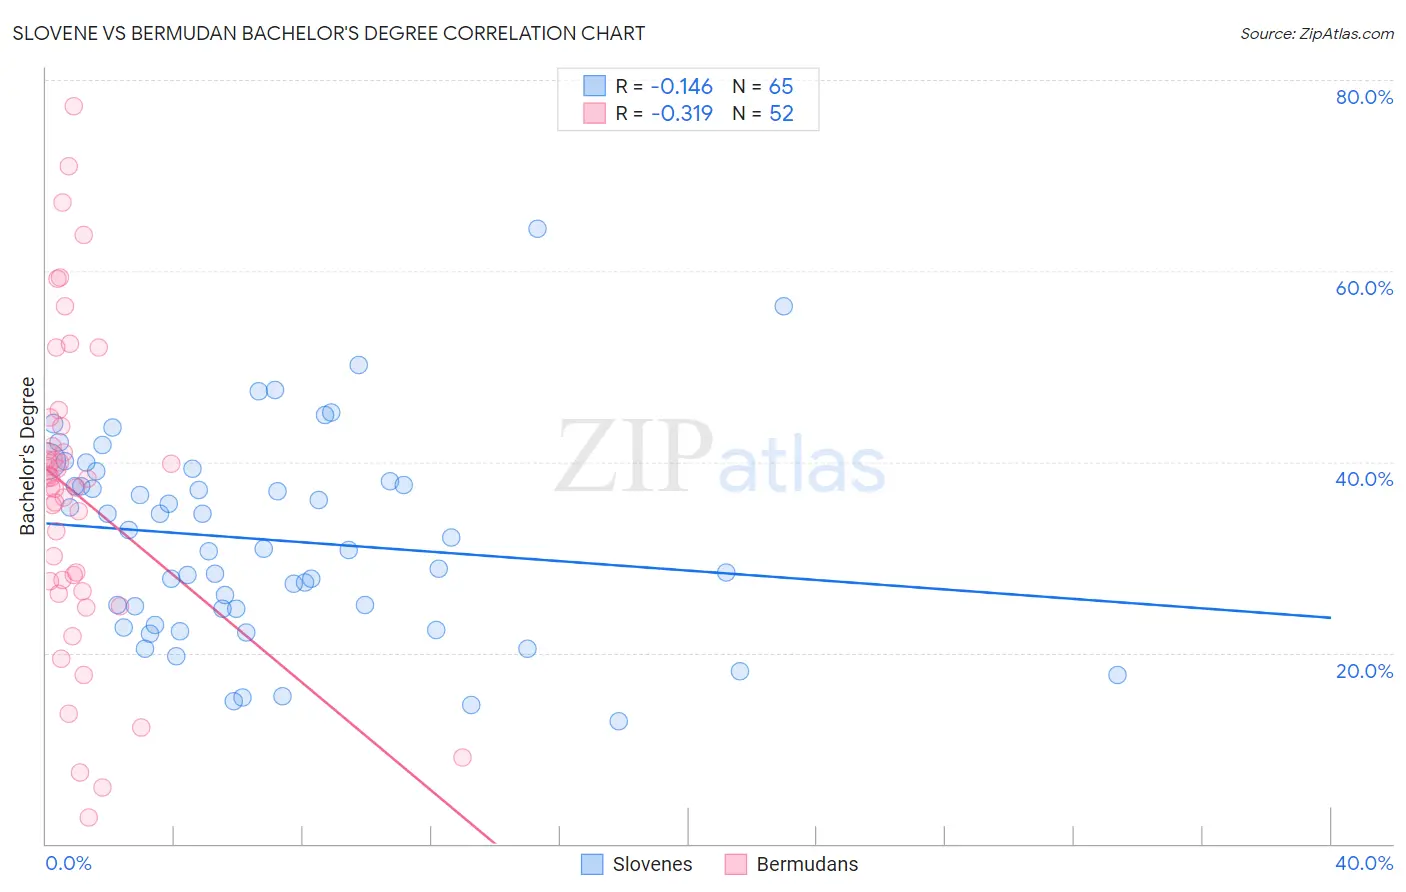
Slovene vs Bermudan Bachelor's Degree Correlation Chart

The statistical analysis conducted on geographies consisting of 261,339,823 people shows a poor negative correlation between the proportion of Slovenes and percentage of population with at least bachelor's degree education in the United States with a correlation coefficient (R) of -0.146 and weighted average of 39.1%. Similarly, the statistical analysis conducted on geographies consisting of 55,732,325 people shows a mild negative correlation between the proportion of Bermudans and percentage of population with at least bachelor's degree education in the United States with a correlation coefficient (R) of -0.319 and weighted average of 38.0%, a difference of 2.9%.
Slovene vs Bermudan Bachelor's Degree

Bachelor's Degree Correlation Summary

MeasurementSloveneBermudan
Minimum12.8%2.7%
Maximum64.4%77.3%
Range51.7%74.5%
Mean31.8%36.6%
Median30.9%37.7%
Interquartile 25% (IQ1)23.8%27.0%
Interquartile 75% (IQ3)38.5%42.7%
Interquartile Range (IQR)14.7%15.7%
Standard Deviation (Sample)10.6%16.3%
Standard Deviation (Population)10.5%16.1%

Similar Demographics by Bachelor's Degree

Demographics Similar to Slovenes by Bachelor's Degree

In terms of bachelor's degree, the demographic groups most similar to Slovenes are Immigrants from Afghanistan (39.1%, a difference of 0.030%), Swedish (39.1%, a difference of 0.040%), Polish (39.1%, a difference of 0.050%), Immigrants from Sierra Leone (39.0%, a difference of 0.070%), and Iraqi (39.0%, a difference of 0.21%).
DemographicsRating | RankBachelor's Degree
Europeans
85.6
/100
|
#138
Excellent
39.5%
Immigrants | Sudan
84.5
/100
|
#139
Excellent
39.4%
Immigrants | Armenia
84.1
/100
|
#140
Excellent
39.4%
South American Indians
83.6
/100
|
#141
Excellent
39.3%
Immigrants | North Macedonia
81.6
/100
|
#142
Excellent
39.2%
Poles
79.8
/100
|
#143
Good
39.1%
Immigrants | Afghanistan
79.7
/100
|
#144
Good
39.1%
Slovenes
79.5
/100
|
#145
Good
39.1%
Swedes
79.2
/100
|
#146
Good
39.1%
Immigrants | Sierra Leone
79.0
/100
|
#147
Good
39.0%
Iraqis
78.1
/100
|
#148
Good
39.0%
Immigrants | Poland
77.5
/100
|
#149
Good
39.0%
South Americans
77.3
/100
|
#150
Good
38.9%
Immigrants | Africa
76.5
/100
|
#151
Good
38.9%
Sudanese
76.4
/100
|
#152
Good
38.9%

Demographics Similar to Bermudans by Bachelor's Degree

In terms of bachelor's degree, the demographic groups most similar to Bermudans are Czech (38.0%, a difference of 0.010%), Ghanaian (38.0%, a difference of 0.11%), Immigrants from Somalia (37.9%, a difference of 0.14%), Immigrants from Iraq (37.9%, a difference of 0.16%), and Danish (38.1%, a difference of 0.20%).
DemographicsRating | RankBachelor's Degree
Hungarians
62.1
/100
|
#164
Good
38.3%
Sri Lankans
59.1
/100
|
#165
Average
38.2%
Somalis
58.6
/100
|
#166
Average
38.1%
Scottish
56.6
/100
|
#167
Average
38.1%
Danes
56.2
/100
|
#168
Average
38.1%
Ghanaians
55.3
/100
|
#169
Average
38.0%
Czechs
54.4
/100
|
#170
Average
38.0%
Bermudans
54.2
/100
|
#171
Average
38.0%
Immigrants | Somalia
52.8
/100
|
#172
Average
37.9%
Immigrants | Iraq
52.5
/100
|
#173
Average
37.9%
Immigrants | Bangladesh
50.0
/100
|
#174
Average
37.8%
Immigrants | Uruguay
48.3
/100
|
#175
Average
37.8%
Costa Ricans
47.6
/100
|
#176
Average
37.7%
Basques
47.4
/100
|
#177
Average
37.7%
Immigrants | Cameroon
46.8
/100
|
#178
Average
37.7%